
 Download PDF
 Contents
 This is an open access article distributed under the terms of the Creative Commons
Attribution License (
This is an open access article distributed under the terms of the Creative Commons
Attribution License (Introduction [TOP]
Self-monitoring theory contends that there are differences in the way individuals use social cues to regulate their self-presentation (Snyder, 1987). High self-monitors (HSM) tend to present desirable versions of themselves to suit their various social situations. In contrast with the chameleon-like HSM, low self-monitors (LSM) tend to present a true-to-themselves versions of themselves across various social situations (Gangestad & Snyder, 2000). Stated differently, HSM uses situational (external) cues to guide their behaviors; they are more likely to adjust their behavior in a direction that is consistent with the perceived attitudes of their audience. In contrast, LSM would be unaffected by the perceived attitudes of their audience because they see themselves (internal) as guides to their own behavior.
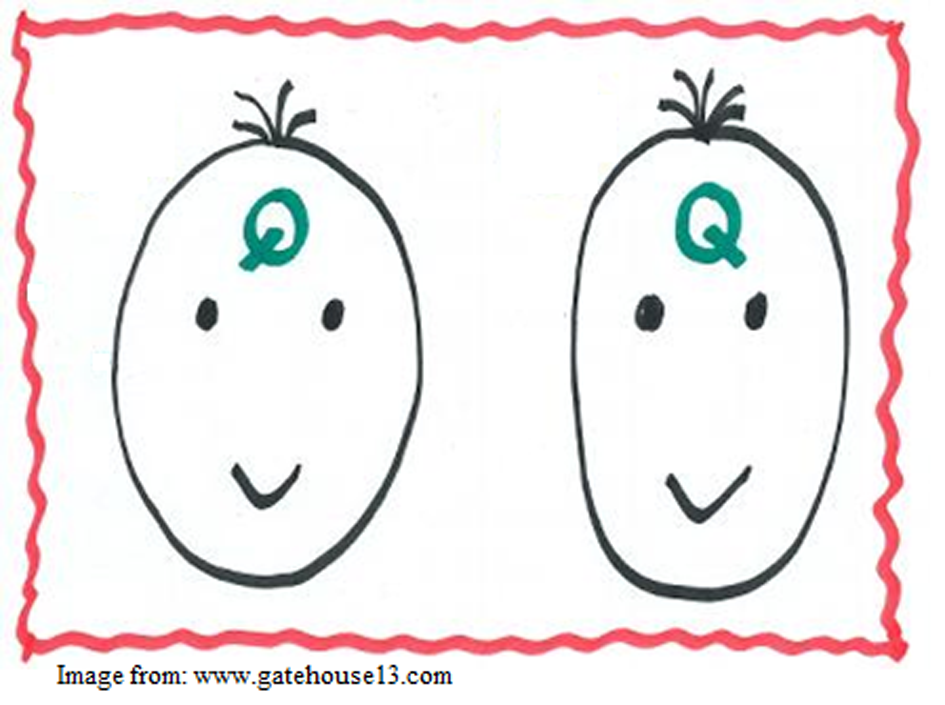
Traditionally, self-monitoring is measured using self-report scales. Snyder developed the original 25-item Self-Monitoring Scale (Snyder, 1972; Snyder, 1974). Gangestad and Snyder (1985) shortened the original 25-item scale to 18 items. The 18-item Self-Monitoring Scale-Revised yielded a .70 Cronbach’s alpha coefficient suggesting that the items had high internal reliability. Interestingly, a more colloquial way of measuring self-monitoring has emerged in popular culture. Tracing the capital letter “Q” on the forehead can supposedly provide a rough estimate of the individual's self-monitoring style. In his book, Quirkology, psychologist Richard Wiseman (2007, p. xi) calls this test the “Q-testi.” The Q-test begins by asking participants to trace a capital letter “Q” on their foreheads using the first finger (index finger) of their dominant hand. The “Q” can be traced in two different orientations (see Figure 1). It can be traced such that its tail is placed in such a way that it is pointing towards the left shoulder, making the “Q” readable to others. It can also be traced such that its tail is placed in such a way that it is pointing towards the right shoulder, making the “Q” readable to the individual. HSM are more likely to trace the “Q” in the Q-for-others orientation whereas LSM are more likely to trace the “Q” in the Q-for-me orientation. As mentioned earlier, HSM are guided by their external cues (e.g., audience) while LSM are guided by internal cues (e.g., myself). Therefore, Q-for-others would correspond to HSM and Q-for-me would correspond to LSM.
The current paper aims to examine the Q-test, a colloquial measure of self-monitoring, presented to the general public by Richard Wiseman in his book Quirkology. We seek to answer whether the Q-test can really be used as a rough measure for self-monitoring, thus we examined the Q-test against a reliable and valid self-monitoring scale. To the best of our knowledge, the Q-test has never been tested against a reliable and valid self-monitoring scale. We measured self-monitoring using the 18-item Self-Monitoring Scale-Revised (SM-R) (Gangestad & Snyder, 1985). Immediately before taking the SM-R, participants' self-monitoring styles were assessed using the Q-test. Results from both self-monitoring measures were then analyzed. We acknowledge that our hypothesis is exploratory in nature. The Q-test may or may not be associated with SM-R. Furthermore, we do not endorse the use of the Q-test in lieu of reliable and validated self-monitoring measures such as the SM-R. The Q-test may or may not offer profound, scientifically-based psychological insights regarding individuals’ self-monitoring styles. However, the simple fact that people respond in different ways to the Q-test is intriguing enough that it warrants further examination.
Method [TOP]
Participants [TOP]
Two hundred ninety-six participants completed an online survey through Amazon's Mechanical Turk – Mturk (“Amazon Mechanical Turk”, 2015) in return for $0.25. An overwhelming number of participants who completed the online survey were scored as LSM and only 89 participants were HSM. To produce a comparable group size between the conditions, 118 participants were omitted from data analyses. Using the random generator function in Microsoft Excel, the experimenters assigned each LSM data point a random number. The random numbers were ranked ordered from lowest to highest. The first 89 LSM data points were included in the data analyses and the remaining 118 were omitted. Data analyses was based on 89 LSM and 89 HSM participants. Participants’ self-monitoring style were determined using the SM-R. Participants comprised of 41 females and 48 males with a mean age of 37.16 (SD = 2.12).
Procedure [TOP]
A Qualtrics Survey was posted on MTurk. Participants were recruited from Mturk. First, participants were informed that the experimenters were conducting a study on personality. Participants were also informed that their responses may become part of a manuscript to be published in a scientific journal article. Then, participants engaged in the Q-test; they were instructed to trace a capital letter “Q” on their forehead using the first finger (index finger) of their dominant hand. Participants then responded to a question that asked them whether the tail of the capital letter “Q” pointed towards their left or right shoulder (see Figure 1 for different orientations of “Q”).
After the Q-test, participants completed the SM-R (Gangestad & Snyder, 1985). Sample items on the SM-R include: “In different situations and with different people, I often act like very different persons” and “I find it hard to imitate the behavior of other people.” Participants responded to the SM-R by indicating “true” or “false” for each of the 18 items. Participants’ self-monitoring scores were computed using a scoring key. After completing the SM-R, participants responded to demographic questions. At the end of the survey, participants were thanked and debriefed on the study’s procedures and purpose.
Statistical Analyses [TOP]
For the Q-test, participants who reported that the tail of their “Q” pointed towards their left shoulder was coded as Q-for-others, and participants who reported that the tail of their “Q” pointed towards their right shoulder was coded as Q-for-me. For the SM-R, participants were categorized as HSM if they scored greater than or equal to 11 on the SM-R, and as LSM if they scored less than or equal to 10 (cutoff scores as suggested by Gangestad & Snyder, 1985). A t-test was conducted to compare SM-R scores between Q-for-me and Q-for-others. A Spearman’s correlation was conducted to determine the relationship of the Q-test and the SM-R. Lastly, a frequency test was conducted to examine the Q-test’s accuracy in categorizing participants into high and low self-monitors.
Results [TOP]
Results of the t-test revealed that Q-for-others significantly scored higher on the SM-R (M = 10.52 SD = 3.86) than Q-for-me (M = 6.18 SD = 3.14), t(176) = 8.23, p < .0001 (see Table 1).
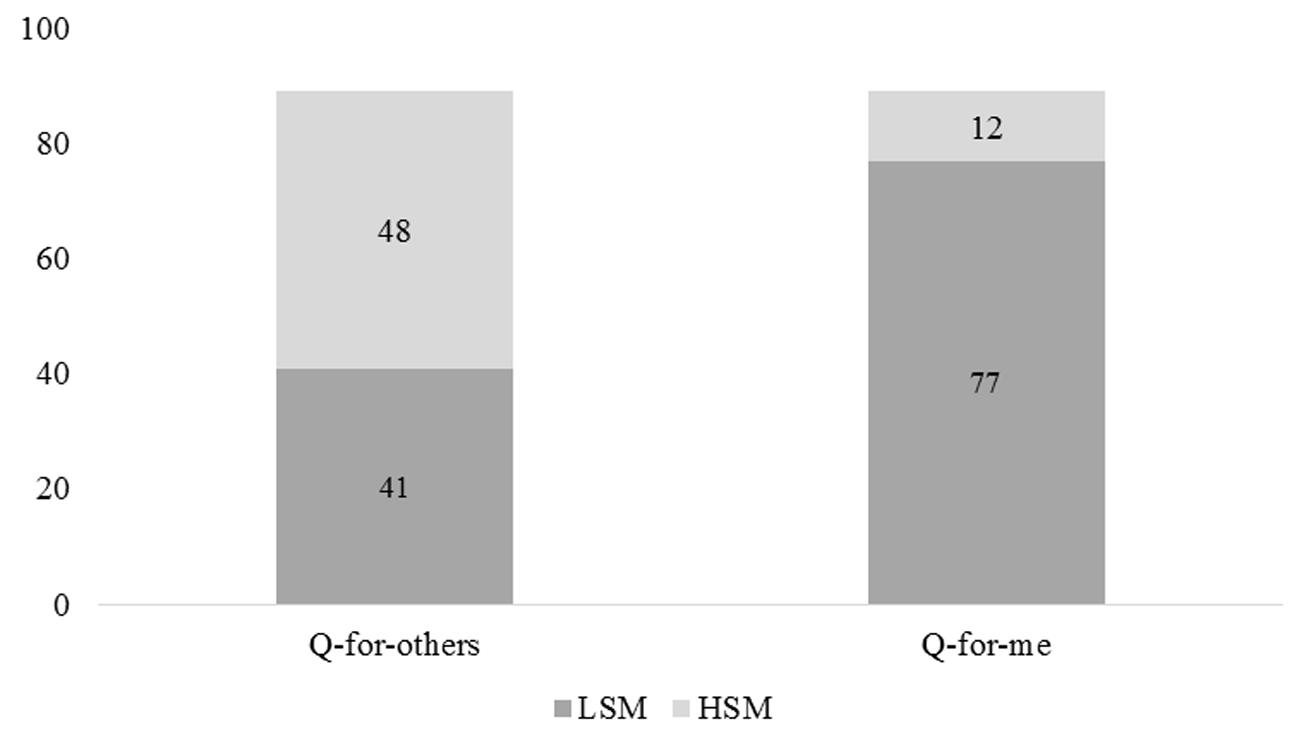
We then analyzed whether the Q-test (Q-for-me = 1 and Q-for-others = 2) is correlated with the SM-R scores (LSM = 1 and HSM = 2). Results of the Spearman’s correlation revealed a positive correlation between the Q-test and SM-R, which was statistically significant, rs = .43, p < .0001 (see Figure 2). A frequency test revealed that 48 (53.59%) Q-for-others participants were categorized as HSM by the SM-R and 41 (46.1%) were categorized as LSM whereas 77 (86.5%) Q-for-me participants were categorized as LSM and 12 (13.5%) were categorized as HSM (see Figure 2).
Conclusion [TOP]
Results suggest that the Q-test could be used as a rough measure for self-monitoring. Q-for-others participants scored significantly higher on the SM-R than Q-for-me participants which implies that Q-for-others participants had higher levels of self-monitoring than Q-for-me participants. When SM-R scores were categorized to LSM and HSM and correlated with the Q-test (Q-for-me and Q-for-others), results showed that the two measures were positively associated. In general, the results follow the self-monitoring theory in that HSM who uses situational (external) cues to guide their behaviors more likely traced the capital letter “Q” in the Q-for-others orientation and LSM who uses themselves (internal) as guides to their own behavior more likely traced the capital letter “Q” in the Q-for-me orientation.
The frequency test revealed that Q-test is more accurate for LSM and Q-for-me participants; 77 out of 89 (86.5%) Q-for-me participants were categorized as LSM by the SM-R, but only 48 out of 89 (53.9%; just above chance) Q-for-others participants were categorized as HSM. Even though randomly omitted, the study’s omission of 118 participants may account for the differences in frequency. The omission may have omitted more Q-for-others individuals by random chance. Another reason could be that HSM are skilled at modifying their behaviors to suit the situation. HSM behave in the direction that is consistent with the perceived attitudes of their audience (i.e., the experimenters). It could be that some HSM participants thought that tracing the capital letter “Q” in the Q-for-me orientation better follows the researcher's hypotheses while others could have thought the opposite. Engaging in the Q-test under a time limit may force both the LSM and HSM to react without bias which may polarize the results.
Furthermore, HSM is a multidimensional self-monitoring style because it depends on multiple external cues. Thus, the Q-test’s lack of accuracy in identifying HSM may be due to its unidimensional design (i.e., it only asks one question). In contrast, the Q-test is more accurate at identifying LSM possibly because LSM is more unidimensional in that LSM see themselves, and only themselves, as guides to their own behaviors. The SM-R is multidimensional with multiple items (reliable and valid) that could better determine individuals’ self-monitoring styles. For these reasons, we do not endorse the use of the Q-test in lieu of reliable and validated self-monitoring measures such as the SM-R. Also, the study has some limitations. Because the Q-test was conducted online, participants’ full participation cannot be guaranteed. We do not know whether participants actually traced a capital letter Q on their foreheads. Also, because the study was online, we could not control participants’ immediate environment. Future research may conduct a similar study in the laboratory where the environment can be more controlled. Future research may also use other person perception constructs such as locus of control (i.e., internal vs. external locus of control) to further examine the underlying differences between individuals who trace the capital letter Q in the Q-for-others orientation and individuals who trace the Q in the Q-for-me orientation.
The Q-test may not be as reliable and valid as the SM-R to offer profound, scientifically-based psychological insights regarding individuals’ self-monitoring styles, however, this study demonstrated that the Q-test carries some merit and perhaps can be used as a very rough measure of self-monitoring.
