
 Download PDF
 Contents
 This is an open access article distributed under the terms of the Creative Commons
Attribution License (
This is an open access article distributed under the terms of the Creative Commons
Attribution License (Introduction [TOP]
More than half of the Americans said that they were current alcohol drinkers (Aronson, 2016) and 86% of men and 80% of women in England reported that within the last twelve months they were exposed to alcohol intake (Fuller, 2012). Alcohol is a macronutrient that can interfere with the cognitive functioning of the individual when consumed (Brust, 2010; Weissenborn & Duka, 2003). Alcohol influences human behavior by increasing and decreasing brain activity in different brain regions and by changing brain’s functional organization (Volkow et al., 2008). When alcohol is ingested, it affects the neurochemical systems of the body (Yeomans, 2004), implicit attitudes prevail and guided behavior (Hofmann & Friese, 2008) and the individual exhibits weaker personal standards (Baumeister, Heatherton, & Tice, 1994).
The findings regarding alcohol consumption and verbal fluency appear to be conflicting. A cohort study of 3,363 subjects showed that moderate alcohol consumption enhanced cognition in non-demented individuals, but did not increase total brain volume (TBV) (Davis et al., 2014). In another study, the cognitive function of 12,480 women aged 70 to 81 years was evaluated. 11,102 of those women underwent a follow-up evaluation. The researchers revealed that women who had 1.0 to 14.9 g of alcohol daily had a 20% decreased cognitive deterioration (Stampfer, Kang, Chen, Cherry, & Grodstein, 2005). In 15,800 participants 45-64 years old, word fluency was positively associated with alcohol drinking, after controlling for education level, age, sex and occupation (Cerhan et al., 1998). Cerhan et al. (1998) actually showed a dose-response effect, where the higher alcohol intake was associated with higher word fluency scores. Wendt and Risberg (2001) showed a reverse trend. The impact of alcohol intake (1 g alcohol/kg body weight) on left dorsolateral prefrontal cortex during verbal fluency was investigated in twenty healthy, male right-handed participants. The researchers indicated that alcohol consumption led to significantly less correct responses when compared to the alcohol-free group (169 vs. 190 words, p < 0.007). Nonetheless, there were no differences in the cerebral blood flow between the two groups.
Previous research on the impact of alcohol intake on human behavior has shown that when participants were given 0.4g of alcohol per kilogram body weight, alcohol simultaneously increased the implicit attitudes and decreased the cognitive restrain standards as revealed by the increased candy consumption (Hofmann & Friese, 2008). A number of researchers have suggested that increased sweet taste response is significantly and positively related to increased risk of extreme alcohol consumption and it has been proposed that the brain reward system may be implicated (Kampov-Polevoy, Eick, Boland, Khalitov, & Crews, 2004; Kampov-Polevoy, Garbutt, & Janowsky, 1999; Lange, Kampov-Polevoy, & Garbutt, 2010). In a previous study, Ghemulet, Baskini, Messinis, Mouza, and Proios (2014) explored any possible relationship between verbal fluency production using verbal fluency tasks (VFT) and a card sorting task in the principal taste domains (i.e. sweet, salty, sour and bitter) in healthy and dysphagic subjects of different body mass index (BMI) ranges. Results showed that the mean number of answers in the principal taste domains under investigation were not statistically different among subjects of the different BMI groups. However, individuals within the higher BMI range generated a greater number of word responses in the sweet domain as compared to individuals in the normal BMI range. In addition, 29.4% (5/17) of healthy subjects and 41.2% (7/17) of the dysphagic individuals organized the cards similar to their VFTs answers. The small sample size and the fact that analysis included only the «top» two card choices may have accounted for these results. In this work, we look at the impact of moderate to light ethanol intake on two similar semantic tasks i.e., verbal fluency and categorical sorting within the different taste domains (i.e. sweet, salty, sour and bitter) in healthy adults. Our hypothesis is that people under the influence of light to moderate alcohol will produce more items in the sweet taste domain and that there is correlation and agreement between the two semantic tasks; i.e. VFT and card-sorting task.
Methods [TOP]
In order to investigate the relationship between the VFT and card-sorting task in the different taste domains, two experimental conditions will be discussed. Condition 1 was replicated and adapted for use from Ghemulet et al. (2014) using healthy individuals without any exposure to alcohol. To further investigate lexical representation, in condition 2 we used the same two semantic tasks i.e., verbal fluency and card-sorting task within the different taste domains (i.e. sweet, salty, sour and bitter) in healthy adults that were exposed to light alcohol consumption.
Experimental Condition 1 [TOP]
Participants [TOP]
Eighty-eight individuals (males 28.4%, 25/88 and females 71.6%, 63/88) with mean age 45.50 ± 18.83 years were recruited through advertisement at different settings like University campus, social centers and business related cafeteria premises (i.e. bank). Screening consisted of a brief interview to exclude subjects with “a history of developmental disorders, substance abuse, or head trauma. None of the participants received any financial remuneration for participating.” (Ghemulet et al., 2014, p. 265). The participants gave their written informed consent and researchers followed the international ethical standards relating to participants in the study.
Measures [TOP]
Similar to Ghemulet et al. (2014), the first task included the four different taste domains “were randomly administrated to eliminate the order effect. Non-taste-related distractor domains (e.g., animals, toys, sports, or colors) were used randomly between the fluency tasks for the four taste-related categories (sweet, sour, salty, and bitter).” (Ghemulet et al., 2014, pp. 263-264). The responses of the VFT were interpreted using the guidelines suggested by previous research (Troyer, Moscovitch, & Winocur, 1997). Specific directions were given to the subjects by the experimenter that included naming only food items. The number of correct answers generated from the VFTs for each taste domain, after the exclusion of errors and repetitions, was calculated.
After the completion of the VFTs, in the second task each subject was requested to perform an additional card-sorting task. In that way, we could investigate the relation between VFT production in each taste domain and the order of taste preferences as revealed by the card-sorting task. “All subjects were presented with four randomly arranged cards, each of which was labeled with the name of one of the four taste domains (i.e., sweet, sour, salty, and bitter). They were requested to put one card on top of the other (i.e., to make a deck of cards) representing the order of preference in the four different taste categories. Therefore, the first card on top would indicate the subject’s most preferred taste domain and the last card would represent his/her least preferred taste domain.” (Ghemulet et al., 2014, p. 265).
Experimental Condition 2 [TOP]
Participants [TOP]
106 male and female new subjects were recruited from local bars, where alcohol is being served, in the metropolitan city of Thessaloniki, Greece. Fifty-three individuals did not drink alcohol (males 18.9%, 10/53 and females 81.1%, 43/53) with mean age 40.70±12.59 years. Fifty-three individuals drank alcohol (males 49.1%, 26/53 and females 50.9%, 27/53) with mean age 42.74±13.58 years. Confounding factors, i.e. age, level of education, history of heavy drinking and whether the participants were on a diet, were taken into account (Table 1). Screening was the same as in Experimental Condition 1.
Table 1
Demographics
| Characteristic | Control
|
Alcohol
|
||||
|---|---|---|---|---|---|---|
| n | % | M (SD) | n | % | M (SD) | |
| Sex | ||||||
| Men | 10 | 18.9 | — | 26 | 49.1 | — |
| Women | 43 | 81.1 | — | 27 | 50.9 | — |
| Education | ||||||
| High School | 18 | 34.0 | — | 10 | 18.9 | — |
| University | 35 | 66.0 | — | 43 | 81.1 | — |
| Diet | ||||||
| Yes | 43 | 81.1 | — | 33 | 62.3 | — |
| No | 10 | 18.9 | — | 20 | 37.7 | — |
| Age | 53 | 100.0 | 40.70 (12.59) | 53 | 100.0 | 42.74 (13.58) |
| BMI | 53 | 100.0 | 29.40 (6.27) | 53 | 100.0 | 23.24 (3.18) |
The only difference in Experimental Condition 2 was that screening also involved asking the participants how many drinks they had per week. Female subjects with ≥8 servings of alcoholic drinks and male subjects with ≥15 drinks per week were excluded. Overall participants were healthy. Participants did not get any financial benefits and gave their informed written consent to take part in the study.
Procedure [TOP]
The first part of Experimental Condition 2 always took part between 21.00-24.00 pm at local bars where alcohol is being served. Moderate alcohol consumption is defined as 5-30 g of alcohol per day, which equals 0.5-2.5 drinks per day (Carlsson, Hammar, & Grill, 2005), since a standard drink contains about 14 grams of ethanol (Centers for Disease Control and Prevention, 2015). According to the Dietary Guidelines for Americans (U.S. Department of Agriculture & U.S. Department of Health and Human Services, 2010), “moderate alcohol consumption is defined as having up to one alcoholic drink per day for women and up to two per day for men.” (p. 1). In this study, acute alcohol consumption was determined as the pharmacological influence of alcohol 15-20 minutes post ingestion (Yeomans, 2004).
Subjects were told that the study had to do with «the effects of alcohol consumption on health» and it involved answering few questions after 15-20 minutes post voluntary ingestion of one serving of an alcoholic drink for women (accounted for about 0.25g alcohol/kg) and two servings for men (accounted for about 0.25g alcohol/kg) based on the definition of moderate alcohol intake of the Dietary Guidelines for Americans (U.S. Department of Agriculture & U.S. Department of Health and Human Services, 2010). They were asked what type of alcoholic beverage they consumed and the investigator informed them of the quantity of the specific alcoholic drink that they had to consume in order to make one serving of alcohol for women and two servings of alcohol for men. One serving of an alcoholic drink is equivalent to 14 g of ethanol. Alcoholic drinks that contain this amount of alcohol are: 12-ounces of beer (5% alcohol content), 5-ounces of wine (12% alcohol content), 1.5-ounces of 80-proof (40% alcohol content) distilled spirits (Centers for Disease Control and Prevention, 2015). When the participants had drunk the assigned servings of alcohol, they had to inform the investigator who was sitting at that particular bar. All subjects in the alcohol-exposed group performed the VFT within fifteen to twenty minutes after the second drink was finished. We performed the test in that time frame, because moderate doses of alcohol increase brain perfusion that remains steady for 100 minutes, within fifteen minutes post moderate to light alcohol consumption (Marxen et al., 2014).
A non-drinking control group was chosen after being asked whether they were drinking tonight. When the first task was completed, the subjects were asked about demographic information, i.e. their current height, weight and diet status. Subjects provided personal information, such as their phone numbers. The investigator contacted each participant for the second task, i.e. card sorting task, after the influence of alcohol was diminished.
Data Analysis [TOP]
The number of responses from VFT, across the different taste domains was measured across both group subject data (i.e. n = 88 in Experimental Condition 1 and n = 106 for Experimental Condition 2). The final values for this quantitative discrete variable resulted after the elimination of repetitions and errors, according to Troyer et al. (1997). Errors in this task refer to those responses that included non-food itemsi. In the case of ties, the sorting of the taste categories based on the number of responses generated at the VFT, was performed at random. The number of responses of every participant produced at the VFTs was compared to a card-sorting task in non-drinkers (control group) and social drinkers.
The overall analysis employed nonparametric statistics, given that the relevant Kolmogorov-Smirnov goodness-of-fit tests revealed that the VFT number of responses deviated from normality (p-values range from < .001 to .049). Specifically, in order to compare the number of responses between the two groups (alcohol vs. control), Mann-Whitney U test was used. Furthermore, this test was also employed in order to explore the differences between the two groups in terms of the total number of semantic clusters, the total number of switches, the total number of response repetitions, as well as the total number of errors made by an individual during the VFT.
A nonparametric Factorial Analysis based on the Aligned Rank Transform and ANOVA procedures was employed to investigate the impact alcohol may have on the number of responses produced by subjects in the VFTs. Spearman’s Rho correlation coefficient was calculated in order to assess the level of correlation between the VFTs and card-sorting task, while the Cohen’s Kappa coefficient was used to assess the level of agreement between the two tasks. Finally, the comparison of these coefficients was employed in order to reveal any potential differences between the two groups.
Results [TOP]
Experimental Condition 1 [TOP]
Taste factor influenced the number of words produced in the VFTs by an individual (Friedman’s test, χ2 = 182.4, p-value <.001). Additionally, there were pairwise differences between all four taste domains in terms of the number of responses generated (Dunn’s tests, p-values range: < .001 to .0474). All subjects appeared to generate more words in the sweet domain, then the salty, followed by the sour and finally the bitter one (p-value <.001 for all the tests). The corresponding basic descriptive statistics are presented in Table 2. Moreover, the 95% confidence interval of the median was [7.0, 8.5] for the sweet taste, [5.5, 7.0] for the salty taste, [3.5, 4.0] for the sour taste, and [1.5, 2.0] for the bitter taste.
Table 2
Basic Non-Parametric (Median, Interquartile Range) Descriptive Statistics of the Number of Responses over the Taste Domainsii
| Taste Domain | Number of responses
|
|
|---|---|---|
| Median | Interquartile Range | |
| Sweet | 8.00 | 4.00 |
| Salty | 6.00 | 5.00 |
| Sour | 4.00 | 3.00 |
| Bitter | 2.00 | 2.00 |
To further study the relationship between the sum of responses produced in the VFTs and the order of the taste-labeled cards, Spearmanʼs Rho coefficient (+ 0.768, 95% CI [0.666, 0.842]) revealed a strong positive relationship between the number of words articulated in the VFTs, and the order of the cards in the sorting task (p-value <.001). Therefore, taste domains that were highly ranked in the VFTs (i.e. more items produced) were also highly ranked in the card-sorting task, while poorly ranked taste domains in the VFT were also poorly ranked in the card-sorting task. Results were straightforward: data provides direct evidence that VFT and card-sorting could be used interchangeably for studying taste domains.
The level of agreement between the two tasks was measured by the Cohenʼs Kappa coefficient. In the case under study, the Cohen’s coefficient is based on whether the first ranked taste domain in the VFT test matches to the first ranked domain in the card sorting task, the second VFT taste domain to the second taste domain in the card sorting task, and so on, i.e. the third, and the fourth. The Cohenʼs Kappa coefficient (0.673, 95% CI [0.616, 0.729]) indicated a good strength of agreement between the responses of the two tasks.
Experimental Condition 2 [TOP]
The Mann-Whitney U results indicated that there were no differences regarding the number of responses produced between the two groups for all four taste domains (p-values: .148, .069, .997, and 0.368, sweet, salty, sour and bitter taste respectively). Specifically, in terms of the median value, the alcohol group was more creative than the control group at the sweet taste domain providing 8 responses (7 responses for the control group), but also less creative in the salty taste domain providing 4 responses (5 responses for the control group). The two groups seem to be similar at the sour and bitter taste domains, providing a median number of 3 and 1 responses respectively.
The relevant descriptive statistics are shown in Table 3.
Table 3
Basic Non-Parametric (Median, Interquartile Range) Descriptive Statistics of the Number of Responses Over the Taste Domains (Control and Alcohol Groups)
| Taste Domain | Number of responses
|
|||
|---|---|---|---|---|
| Control
|
Alcohol
|
|||
| Median | Interquartile Range | Median | Interquartile Range | |
| Sweet | 7.00 | 3.50 | 8.00 | 4.00 |
| Salty | 5.00 | 4.00 | 4.00 | 4.50 |
| Sour | 3.00 | 2.00 | 3.00 | 2.50 |
| Bitter | 1.00 | 2.00 | 1.00 | 2.00 |
Mann-Whitney U tests showed that the total sum of clusters, switches, repetitions, irrelevant of taste domain, were equal between the two groups irrelevant of the taste domain (p-values: .211, .401, and .684 respectively). On the other hand, the alcohol group produced statistically significant more errors when compared to the alcohol free group (p-value: <.001, median: 1 for the alcohol group vs. 0 for the alcohol-free group).
The relevant descriptive statistics are presented in Table 4.
Table 4
Basic Non-Parametric (Median, Interquartile Range) Descriptive Statistics of the Number of Responses Over the VFT Variables (Control and Alcohol Groups)
| VFT Variable | Number of responses
|
|||
|---|---|---|---|---|
| Control
|
Alcohol
|
|||
| Median | Interquartile Range | Median | Interquartile Range | |
| Semantic Clusters | 2.00 | 2.00 | 2.00 | 2.00 |
| Switches | 15.00 | 4.00 | 14.00 | 8.00 |
| Repetitions | 0.00 | 0.00 | 0.00 | 0.00 |
| Errors | 0.00 | 1.00 | 1.00 | 2.00 |
Specifically, the Spearman’s Rho coefficient for the control group (+0.81, 95% CI [0.74, 0.86]) revealed a strong positive correlation between VFT responses and sorting-task responses (p-value < .001), while the correlation for the alcohol group was rather moderate (+0.57, 95% CI [0.47, 0.66], p-value < .001).
Finally, the level of agreementiii – as a measure of consistency – expressed through the Cohen’s Kappa coefficient, between the two semantic tasks was also different (p-value < .001). Specifically, the Cohen’s Kappa coefficient for the control group (+0.71, 95% CI [0.65, 0.78]) revealed a strong consistency between VFTs and card-sorting task responses, while the consistency for the alcohol group was rather moderate (+0.46, 95% CI (0.37, 0.55]).
The relevant results are presented in Figure 1 (for controls) and Figure 2 (for the alcoholic group).iv
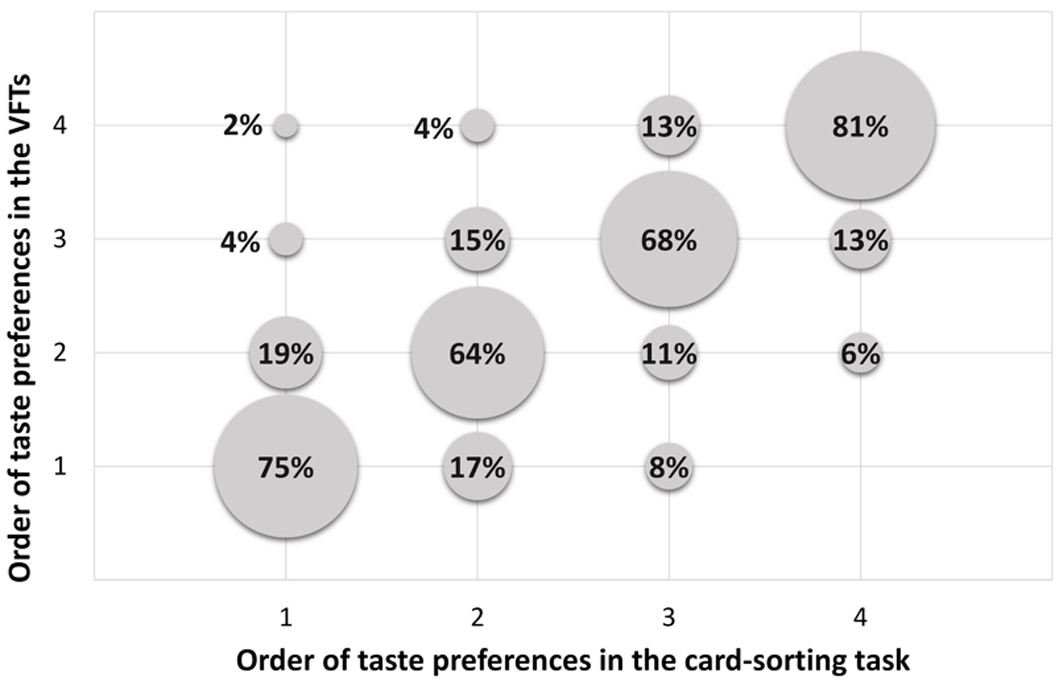
Figure 1
Relative frequencies of Verbal Fluency Tasks (VFTs) over card-sorting task (control group)
Note. 1 = taste domain most preferred in the card sorting task and the taste domain that generated the greatest word responses in VFT, 2 = second most preferred taste domain in the card sorting task and the taste domain that generated the second greatest word responses in VFT, 3 = third most preferred taste domain in the card sorting task and the taste domain that generated the third greatest word responses in VFT, 4 = least most preferred taste domain in the card sorting task and the taste domain that generated the least word responses in VFT.
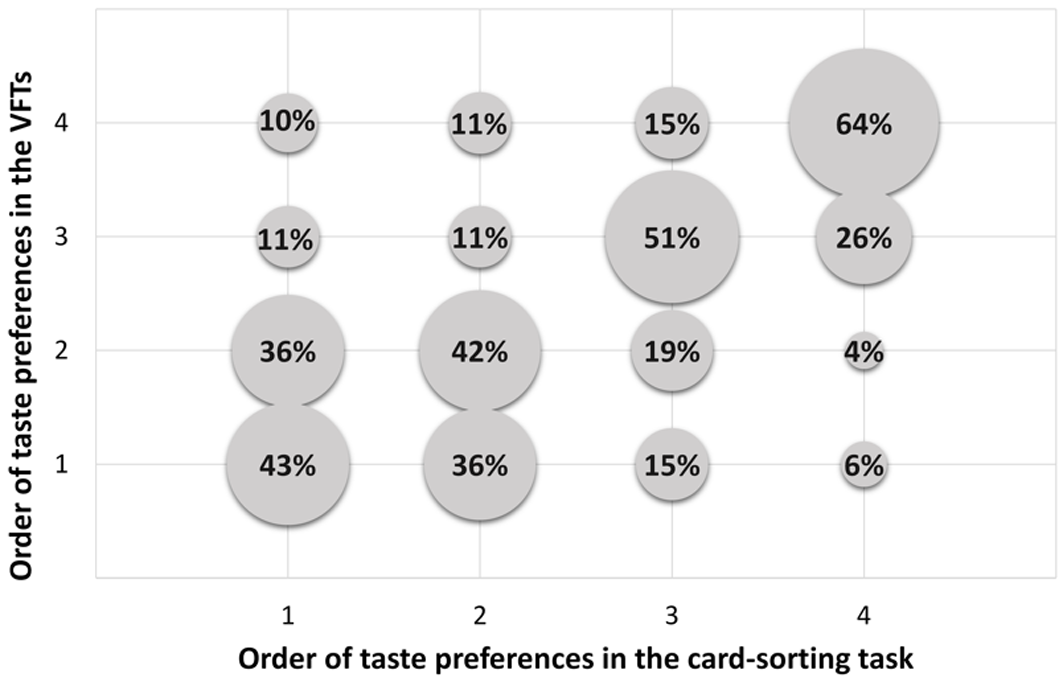
Figure 2
Relative frequencies of Verbal Fluency Tasks (VFTs) over card-sorting task (alcohol group)
Note. 1 = taste domain most preferred in the card sorting task and the taste domain that generated the greatest word responses in VFT, 2 = second most preferred taste domain in the card sorting task and the taste domain that generated the second greatest word responses in VFT, 3 = third most preferred taste domain in the card sorting task and the taste domain that generated the third greatest word responses in VFT, 4 = least most preferred taste domain in the card sorting task and the taste domain that generated the least word responses in VFT.
Discussion [TOP]
The results from both experimental conditions presented a picture that taste domain is an important determinant in the number of words generated in the VFTs. All participants, irrespective of the alcohol status, produced the greatest sum of answers in the sweet, then salty, sour and finally bitter domain. This is in accordance with our previous findings, where the effect of BMI status was under consideration (Ghemulet et al., 2014). Semantic representations of taste-related words are closely related with certain brain regions responsible for gustatory processing and linked to activating taste domains (Barrós-Loscertales et al., 2012; Goldberg, Perfetti, & Schneider, 2006). It has been proposed that taste knowledge (words semantically related to taste) activate the orbitofrontal cortex (OFC). OFC is not only involved in decision-making, but also influences the representation and process of semantic taxonomies that are taste related, i.e. in taste reward (Rolls, 2012). In other words, OFC encodes and represents the affective aspect of taste stimuli. The affective properties of food rely upon its sensory qualities as well as deep cognitive processing at a language level. Cognitive word labels such as “rich and delicious taste”, “cheddar cheese” and “body odour” alter the pleasantness of taste in OFC (Grabenhorst, Rolls, & Bilderbeck, 2008).
Subjects from the alcohol group tended to produce slightly more words in the sweet domain than the non-alcohol group (6.85±2.58 vs. 7.85±3.28) and marginally fewer words in the salty category (5.98±3.00 vs. 5.06±3.00), but the differences were not significant. Literature suggests that the slight shift towards the sweet taste domain and marginal withdrawal from the salty taste category after acute alcohol consumption may be due to the mesencephalic dopamine (DA) system. The DA system, where dopamine is involved, regulates the hedonic (liking) and rewarding (wanting) mechanisms that influence the pleasure and motivation to food intake and stimuli. DA pathways are located in the mesocorticolimbic area of the brain (Davis et al., 2007). On the other hand, alcohol affects the mesocorticolimbic area, frontal and temporal lobes (Robinson & Berridge, 2008). Consequently, alcohol may exert an impact on the DA system and in turn affect the number of words produced in the sweet domain. The sweet domain includes foods that traditionally yield pleasure. In addition, alcohol leads to disinhibited behavior and therefore the subjects under the influence of alcohol may have felt more «free» to generate words that came to their minds without the «social desirability» effects. The marginal effect of alcohol and the fact that no greater effect was observed may be due to the low doses of alcohol ingested (0.25g alcohol/kg body weight).
Previous researchers have found that there is a positive link between ethanol consumption and the word fluency (Cerhan et al., 1998). Nonetheless in our case, acute light alcohol intake (0.25g alcohol/kg body weight) did not influence VFTs production in the different taste domains. Alcohol intake leads to enhanced cerebral blood flow (Marxen et al., 2014), which in turn is associated with better cognitive function (Meyer et al., 1988). Moderate doses of alcohol (0.6g/kg breath alcohol concentration) boost cerebral blood flow, mainly in frontal and/or temporal lobes (Marxen et al., 2014).
In both experimental conditions the sum of responses in the VFTs and the order of the taste-labeled cards in the sorting task showed a positive correlation and agreement. The difference was that in the second experiment the responses of the control group in the VFTs and the card-sorting task demonstrated stronger correlation and agreement as compared to the moderate correlation and agreement between the two tasks in the alcohol group.
Taste and food preferences are a major factor influencing food choice. Thus, the indirect semantic assessment of taste knowledge through VFTs has a neuroscientific basis and may provide information about taste preferences and subsequent food decision intake. This finding leaves open question whether VFTs can implicitly assess taste and in extrapolation food preferences. This is particularly important because taste preferences are very difficult to be implicitly measured in adults, because they can control their responses through cognitive mechanisms. Direct assessment of food preferences is subject to social and psychological desirability tendencies (Schwarz & Oyserman, 2001), vulnerable to defensive responsiveness bias and depends on the participant’s willingness to state his/her thoughts, beliefs and preferences. Indirect measures capture thoughts and beliefs that are automatically generated and lie outside of consciousness or direct control (Roefs, Werrij, Smulders, & Jansen, 2006). VFT is an indirect, divergent-thinking task and therefore allows the evaluation of the affective element behind the concept involved. This is important since taste preference also involves an emotional aspect (Noel & Dando, 2015; Yamamoto, 2008). In Experimental Condition 2 our aim was to explore whether alcohol influences the responses in the VFTs and the card-sorting task. Participants that are under the influence of alcohol exhibit a more disinhibited behavior since they are less affected by social influence. Social influence can have an effect on one’s emotions, opinions or behaviors even without his/her awareness. Hofmann and Friese (2008) showed that when participants were given 0.4g of alcohol per kilogram, alcohol simultaneously increased the implicit attitudes and decreased the cognitive restrain standards. When subjects where under the acute influence of moderate to light alcohol intake (0.25g alcohol/kg body weight, more specifically approximately 14g alcohol for women and 28g alcohol for men), the sum of items produced in each taste domain in the VFTs and the order of taste preference in the card-sorting task were still in agreement and positively correlated, but only moderately. The two experiments provide valuable information, but this question needs to be examined by better-controlled studies with a greater sample size.
Alcohol depresses the action of the central nervous system, but certain brain areas are more affected than others. Our results from Experiment 2 indicated that light to moderate alcohol did not affect verbal fluency for the two groups. There were no differences in clusters, switches and repetitions between the two groups. However, participants under the influence of alcohol generated significantly more errors in the VFTs that were non-food items emotionally-laden (“kiss”, “friendship”, “love”, “fairy tale” in the sweet; “sadness”, “ separation”, “sea” in salty, “meds”, “tears” in bitter and “hatred” in the sour domain respectively).
After acute moderate alcohol consumption (≈ 0.70 ml/kg alcohol for females and 0.75 ml/kg alcohol for males), participants experienced increased brain perfusion, especially in the frontal brain area. Acute alcohol ingestion leads to numerous brain changes, i.e. event-related potential latency, hormonal adjustments, and enhanced cerebral blood flow (Tolentino et al., 2011). Light to moderate drinking does not affect cognitive functioning in that way and also does not seem to affect brain volume (Kubota et al., 2001). In this paper we dealt with the acute effects (≈15 minutes post ingestion) of moderate to light alcohol consumption (0.25g/Kg body weight). This may be the reason that no differences in clusters, switches and repetitions between the two groups were found (Mann-Whitney U tests, p-value = .211; .401; .684 respectively).
Interestingly, participants in the alcohol group made more errors in all taste domains, which were emotionally laden. That is that these verbal productions are exacerbated with alcohol consumption. Such results center around the fact that people become disinhibited under the influence of alcohol and do not necessarily filter what they say in fear of saying something that is irrelevant. This corroborates with research that certain emotions are innervated with particular taste domains. Food does not only yield the nutrients essential for survival, but food is associated with beliefs, attitude, and social meanings and may even define self-identity (Ogden, 2010). In the current study alcohol may have led to disinhibited verbal production and interestingly certain emotions were associated with specific taste domains. No such effect was observed in the non-alcoholic group or in Experiment 1. In particular, words like “kiss”, “friendship”, “love”, “fairy tale” were affiliated with the sweet flavor; “sadness”, “ separation”, “sea” with the salty; “meds”, “tears” with the bitter and “hatred” with the sour domain. The fact that emotions are so tightly connected to different taste domains leaves open question about the effects of alcohol on decision-making in eating and the different taste domains as they relate to implicit lexical representations.
Issues such as small sample size and a fifth taste reported in the literature “umami” (Lindemann, Ogiwara, & Ninomaya, 2002) were not addressed in this study. In a primary attempt people were unaware of the umami taste and they showed lack of knowledge and thus the umami taste was excluded from the VFTs. However, from the participants’ answers it was deducted that umami taste was merged with the salty taste category (e.g. Meat with salt) to be placed under the “umbrella” of savory food preferences. This should certainly be addressed in a systematic way in further studies. From an applied perspective, certain emotions are innervated with particular taste domains and this may influence the decision made on food choices. Indeed, this work may offer an interesting model for studying the dynamics of the lexicon as it relates to verbal productions and the consequences of alcohol on such cognitive processes.
