
 Download PDF
 Contents
 This is an open access article distributed under the terms of the Creative Commons
Attribution License (
This is an open access article distributed under the terms of the Creative Commons
Attribution License (The number of college students shows a continuous increase whereas the expansion of new technologies has adjusted teaching culture in various aspects, including the organisational, economical, contextual, academic, behavioural, etc. New didactic practices were assimilated very fast, such as virtual campuses, uploading evaluations, online classes, the integration of cultures and regions, distributed learning, the use of images to illustrate ideas and even, sometimes prevailing over verbal ideas, etc. (Buendía Espinosa, 2007; UNESCO, 2005). These changes have raised the debate on learning quality and its improvement in university classes.
Considering the above, creativity arises as an important subject in higher education. UNESCO (1998) stresses the importance of stimulating creative analysis in students, allowing them to get the skills to manage their own learnings when they will obtain their degrees.
CEPAL (2011) highlights these new techniques and technologies, strongly advocating the implementation of policies oriented to encourage their use with undergraduates. For two decades both organisations agreed that this interaction between knowledge and technology plays a main role in the educational setting. Its huge growth produces academic changes which require the development of students' new skills, promoting innovation and creativity (CEPAL-UNESCO, 1991). Locally, the Law of Education #26.206 (Ministerio de Educación de la Nación, 2006) states that students should be provided of some training to foster the improvement and/or development of their creative repertoire. Hence, assessing creativity arises as useful when planning improvements in educational practices and teaching programs. This information will provide data on the baseline to be considered by teachers in class as a starting point.
Creativity [TOP]
One of the most consensual definitions of creativity describes it as the capacity to produce new meaningful ideas from current existing concepts, emphasising the variety, quantity and relevance of the results obtained (Guilford, 1987). It involves the notion of a process which combines different cognitive operations in order to generate innovative productions. This process includes two main concepts, such as previous experience and the skills to integrate recent and preceding perceptions. Originality (linked to innovation), fluency (regarded to a big amount of ideas), flexibility (associated to constant change in the ideas which were generated), elaboration (connected to beautifying basic ideas), remote associations, interest, and cognitive styles, can be distinguished within the group of skills required to integrate former and current perceptions (Getzels & Jackson, 1962; Guilford, 1967; Mednick, 1968; Rodríguez Pascual, 2005; Sternberg, 1999). All these cognitive operations get their expression through different means, such as graphic, verbal, musical, dancing, etc. Moreover, the skills to handle these ways of expression represent another aspect which determines a person’s degree of creativity.
Due to the fact that in Western culture verbal and graphic creativity are socially valued over other forms of expression (Dӑu-Gaşpar, 2013), both them are the most analysed in education contexts (e.g. Ayob, Hussain, Mustaffa, & Majid, 2012; Friedel & Rudd, 2006). Moreover, the study of the information processing is developed through the analysis of the usual channels of communication in teaching situations (verbal and visual). Thus, the attention is focused on examining the preference to process words and/or images (Mayer & Massa, 2003).
Creative Process: Verbal and Graphic Expression [TOP]
The ways of expressing creativity evolve during life, following a series of developmental stages with variations in the level of expressiveness. Children from two years old gradually drop sensorial perception as the means to know reality (Gardner, 1997). As children begin to master some symbolic means, they get an indirect knowledge of situations by using different ways of communication including language (verbal, graphic, etc.), dancing, playing, music and crafts.
When children attain a certain level of proficiency in drawing or speaking (about six years of age), they are able to combine shapes involving creative products (fantastic graphics, neologisms) which seem generally strange from the adult viewpoint. Then, a phase of adaptation to conventions starts, combined with a wider participation in social activities. Named as the literal stage, its production is restricted to the rules in force, reducing figurative and verbal expression to the exact copy of images, as well as the literal use of words (Gardner, 1997). This phase is central since it leads to an increased comprehension and reaction to the work of others, allowing the comparison of these productions to the own ones. However, it is expected that after the child finalises this stage, creative ability will be recovered in some way. Its essence will be different from the previous one since these new expressions will represent a more profound awareness of the rules which were broken, and of the will to do that, at the expense of some psychological energy. About the end of the literal stage, creative potential will determine the individual’s expressive skills, both graphic and verbal. They will depend on multiple factors, being the most relevant the innate talent, the social environment, the type of raising and the pedagogies used by the family and school, personality traits and, of course, the speed at which the student goes through the phase (Csikszentmihalyi, 1996; Gardner, 1997).
With these expressive skills showing a certain degree of development, freshmen start higher education. That is the reason why it is important to establish individual differences by means of assessment procedures in order to adapt teaching to specific features of students and groups, according to each major’s syllabi.
Assessing Creative Process in College Students [TOP]
Regarding the analysis of creative process in the higher education level, some studies have verified its link with academic achievement (Getzels & Jackson, 1962; Naderi, Abdullah, Aizan, Sharir, & Kumar, 2010; Pérez Fabello & Campos, 2007). Findings show that diverse ways of creativity could be associated to diverse competences in different professional fields (Esquivias Serrano & De la Torre, 2010), emphasising the role of this variable in learning enhancement as well as in the individual’s ability to establish relationships within informational items apparently unconnected (Martínez Zaragoza, 2010).
Noteworthy to mention that most psychometric studies conducted in college students analyse the procedural dimension of creativity (e.g. Boonchan, Pupat, & Seesan, 2015; Kharkhurin & Samadpour Motalleebi, 2008; Pan & Yu, 2016). This is commonly measured through verbal statements and/or graphs corresponding to symbolic expressions made by language units (words, lines), where their combination of meanings are easily grasped. That differs from art expressions (painting or poetry, for instance), where the meaning does not rest on the sum of pictorial symbols but on the whole production (Gardner, 1997). Furthermore, simple verbal and graphic productions (differentiated from the plastic artistic ones) seem easier to be assessed – and they are the ones stimulated mostly by the formal educational system –, as opposed to music, dancing or plastics, which involve a deeper complexity.
Multiple tests designed to assess the creative process are currently available, standing out those focused on both expressions (verbal, graphic) and those only examining a single creative product. The first group, mostly composed of large batteries containing verbal and figurative tests, involve long periods of examination (e.g. Artola et al., 2012; Guilford, 1967; Torrance, 1974). On the other hand, some of those integrating the second group consist of a lower number of items, being shorter in terms of examination time (e.g. Corbalán Berná et al., 2006; De la Torre, 2006; Urban, 1995). This shortness results more attractive when selecting scales to conduct collective assessment processes.
Currently in Argentina and especially in Buenos Aires, the CREA Test (Corbalán Berná et al., 2006) is available to measure the verbal expression of creativity in college students involving short periods of examination. However, there are very few tests assessing graphic creativity. Consequently, this study explores the adaptation of the Graphic Creativity Assessment – Evaluación de la Creatividad Gráfica (ECG) – (De la Torre, 2006) to be used in college students from Buenos Aires, in order to put it forward to educational psychologists from universities, complementing thus the existing verbal tests of creativity. Taking into account that contents are predominantly verbal and graphic in the educational system, the joint assessment of both creativity types seems to be appropriate. This joint assessment will allow an integrated vision of the concept, oriented to design actions to improve traditional learning and, subsequently, educational quality (Singh & Sudarshan, 2003).
Graphic Creativity Assessment Test [TOP]
The underlying model of ECG was posed by De la Torre (1991, 2006), who asserts that the creative process is determined by personal (cognitive, affective, conative) and environmental factors. Some features of both and the way in which they combine define graphic production as an indicator of creativity. Thereby, an innate tendency to perceive the environment, which is shaped by personal factors above mentioned, transforms such environment in a certain way. Indeed, contextual features (family, educational institutions, social circumstances, historic situations, etc.) play an important role as well. This interaction generates dispositions and attitudes which determine each creative act.
Three types of operations lead creative processes. They are perception, integration, and expression. They rest, from a theoretical perspective, on two models: the Gestalt and the Social-cognitive approaches. The first operation, the perceptive one, is the first link to get a changing, problematic and unstable reality. Therefore, it brings forth multiple interpretations. Perception provides significance, in order to turn reality comprehensible. Perception is crucial in the creative process, since it determines how a person responds in a given scenario. Individuals who excel in this area are able to process a large number of problematic situations as something open, unfinished and perfectible. More creativity supposes a different perception of the problem and, hence, different and innovative solutions. On the contrary, students who possess less creativity solve most situations using the most direct, standard and simple ways (De la Torre, 2006).
Integration, as the second operation in the process, refers to the interaction produced by the individual skills with the social environment. That interaction determines which stimuli will be perceptually selected from the milieu in order to solve a given problematic situation. Undoubtedly, insertion into a stimulating social environment is essential in creative achievement. Creative potential increases when learning, experiences, expectations, interests, motivations, and even traumatic events are guided by a project. The influence of the factors mentioned before is usually observed. Only the most creative persons will be able to integrate cognitively their strengths and weaknesses for the benefit of their own productions.
Last but not least, expression arises as a capital component, since it constitutes the way to convey thoughts and ideas to the community, in order to obtain their social recognition. It is worthy to underline that the success of an idea relies on its social valuation. So, to obtain this approval requires some skills to express them in an attractive, flexible, original and elegant manner, captivating the audiences for which it is intended.
The developmental level of each of these actions – perception, integration, expression – and the proper coordination of them determines the degree of graphic creativity of the individual in order to generate a product considered as such. De la Torre (2006) focuses on the degree of articulation among these three operations and its role in creative production instead of analysing each one separately. This way, he poses 12 indicators representing the integration among those three operations – perception, integration, expression, leading to obtain a general measure of individual’s graphic creativity in the ECG, hypothesized as one-dimensional.
This scale consists of a quadrant with nine simple figural fragments, six of them placed inside and three placed outside. These stimuli can be used with examinees of any age. As for productions, each one of these nine stimuli are rated according to 12 predetermined indicators – Resistance to Closure, Figurative Resignification, Originality, Elaboration, Linear Connectivity, Thematic Connectivity, Expansive Connectivity, Fantasy, Graphic Ability, Sense of Humour, Creative Graphic Fluency and Graphic Creativity. The total score offers a measure of graphic creativity, representing the general individual skill to integrate the nine stimuli in a significant sketch. The original version of the test includes an internal consistency analysis with adequate results in every case, except for Resistance to Closure (De la Torre, 2006). There are no studies developed to examine validity evidences in other contexts up to the moment.
As the Graphic Creativity Assessment (ECG) (De la Torre, 2006) is a short scale with brief and simple procedures of examination and scoring, this study is intended to adapt it to college students from Buenos Aires, in order to get a graphic measure of creativity to complement the verbal measure yet provided by CREA Test (Corbalán Berná et al., 2006). To achieve this goal, face and construct validity evidences – confirmatory factor analysis and convergent validity – on one hand, as well as an inter-rater, test-retest reliability and internal consistency studies will be developed, on the other.
Method [TOP]
Design [TOP]
The study developed was transversal, psychometric, correlational and explicative, according to their goals (Gorsuch, 1983; Harrington, 2009; Nieto Martín & Rodríguez Conde, 2010; Raykov & Marcoulides, 2011).
Instruments [TOP]
ECG Test: Graphic Creativity Assessment [TOP]
ECG Test (De la Torre, 2006) assesses, by means of graphic production, the creative skills from a figurative viewpoint, by considering the ability to generate one or more sketches with different degrees of complexity from a series of stimuli. They are 9 figural fragments, distributed around a frame (six inside and three outside) and the examinee must give some significance to them, completing the design drawing a sketch. In the original version scores were calculated by means of the same 12 indicators for each design, using dichotomous (0-1) and polytomous (0 to 9) scales. They allow the qualification of every design viewing the treatment given by the examinee to each indicator (Table 1). Besides, the test requires the development of a complementary interview to ask about areas such as thinking, feelings, emotions and behaviors. Regarding the design implied in the study, and the procedures planned for data gathering, which involved collective sessions, the interview was excluded, thus excluding the Graphic Creativity indicator as well. The score of this indicator could be only calculated in view of the interview responses. This point will be reported below, in the paragraphs dedicated to the inter-rater reliability study. There is no time limit to solve the activity and the test is considered as a long age instrument, since it can be used in any age group. It has been developed in Spain and there are no local adaptations available.
Table 1
ECG Test. Description of the 12 original indicators by De la Torre version (2006).
| Indicator | Score Type | Definition |
|---|---|---|
| Resistance to Closure (Rc) | 0-1 | It rates the disposition to control tension towards immediate closure in open figures allowing the appearance of other less usual solutions, requiring more time and more elaboration. |
| Figurative Resignification (Fr) | 0-1 | It refers to a transformational attitude which allows the individual to attribute new sense to stimuli by means of non-substantial changes |
| Originality (Or) | 0 to 9 | It alludes to the innovative, unusual, remote or ingenious character of sketches, meaning all the ones which are not stereotyped. |
| Elaboration (El) | 0 to 9 | It gives the production an attraction and completion which goes beyond the necessary elements to express and idea, thus enriching and enhancing the product. |
| Linear Connectivity (Lc) | 0-1 | Defined as the skill to relate physically stimuli which are next to each other. |
| Thematic Connectivity (Tc) | 0-1 | Capacity to elaborate a thematic unit from the connection of lines or stimuli, giving a superior significance to them. In order to do this, the examinee must be able to represent the goal in his/her mind, valuing it by regarding its distance from original stimuli. |
| Expansive Connectivity (Ec) | 0 and 3 | It is the disposition to break perceptual limitations, prejudices, conventions, opening the possibility to find innovative solutions to problems. It implies the use of a perception able to integrate far or unlikely stimuli. Hence its assessment is only for the three figures located outside the frame. |
| Fantasy (Fa) | 0 to 9 | It identifies the skills to integrate real and unreal things, making familiar strange images and so on, and shaping non-existent objects. |
| Graphic Skills (Gs) | 0 to 9 | It names the skills to express an idea in a graphic shape, requiring a special handling of the code and graphic techniques, which are acquired by practicing. |
| Sense of Humour (Sh) | 0 to 9 | It is related to open minds, which facilitates the generation of ingenious associations representing two aspects, constituting the essence of humour. |
| Graphic Fluency (Gf) | Total scores / Time employed | It alludes to the ability to express multiple ideas using the same code, managing it remarkably. |
| Graphic Creativity (Gc) | Interview and results | It describes the global expression of creativity, conducted by a qualitative analysis of test results, as well as those derived from the interview (see Inter-rater reliability, below). |
CREA Test [TOP]
CREA Test (Corbalán Berná et al., 2006) assesses the creative process from a verbal perspective. Examinees must generate as many written questions as possible, regarding an image-stimuli presented during allotted 4 minutes. Following the authors this scale offers a one-factor measure of the concept, represented by the sum of scores obtained by every question, valued considering the number of cognitive schema used by the individual when developing the activity. It includes three sheets (A, B and C), designed to be used with different age groups. Thus, CREA A can be used with children from 10 years; CREA B, from 12 years and more and CREA C, from 6 years and more. Every sheet can be employed individually, except with children between 6 and 9 years, who must use only individual examinations and oral responses, instead of the written ones. Despite the existence of three sheets, only one of them is presented, according to the examinee’s age. When a retest is needed, a different sheet can be used, changing that employed in the first procedure. To conduct this study, only Sheet A was utilized, since it corresponds to the age of the participants. CREA has been locally adapted to Argentina (Corbalán Berná et al., 2006). It obtained predictive validity evidences, and criterion validity evidences related to another creativity test (external criterion). Discriminant validity evidences referred to intelligence were analysed as well. The test reliability was also studied employing parallel measures by means of the sheets A, B and C. Results show adequate psychometric features in order to apply the test in local population.
Personal and Academic Survey [TOP]
A personal and academic survey was used to describe the sample in terms of sex, age, public/private University, and type of major.
Participants [TOP]
An incidental-simple sampling was used. College students attending at least their second year-term were included. Cases with omitted responses were excluded to avoid missing data.
Face Validity Study [TOP]
30 Psychology students (26.7% males, 73.3% females), with ages between 21 and 34 years (M = 24.43; SD = 3.44).
Inter-Rater Reliability Study [TOP]
3 psychologists trained in tests examination and scoring traded answer sheets from 20 Biological, and Computer Science and Technology students (40% males, 60% females) with ages between 21 and 35 years (M = 24.70; SD = 3.42).
Construct Validity and Internal Consistency Studies [TOP]
350 college students (33.7% males, 66.3% females) from 18 to 35 years (M = 24.8; SD = 2.92) participated both in convergent validity evidences and confirmatory factor analyses. All of them attended public universities, considering diverse majors (14.29% Psychology, 14.29% Philosophy and Literature, 14.29% Laws, 14.29% Medicine, 14.29% Biology, 14.29% Computer Sciences and Technology, 14.29% Engineering).
Test-Retest Reliability Study [TOP]
36 Psychology students (22.2% males, 77.8% females) from 21 to 46 years old (M = 26.08; SD = 5.58).
Procedures [TOP]
Data were gathered in class, conducted by a properly trained psychologist. Participants were volunteers, and they did not receive economic retributions. Everyone signed an informed consent. Results confidentiality were securely guaranteed, as well as data anonymity, informing participants about the possibility of stopping responses at any moment of the assessment. The study obtained institutional endorsements.
Face Validity Evidences Study [TOP]
First, intending the standardization of the examination conditions, it was established an interval of 10 minutes to respond the test. This decision, modifying the original version, was made considering intervals set in the Torrance Tests of Creative Thinking (Torrance, 1974), which assesses graphic activities. Afterwards the scale was tested in a pilot study developed in a small group composed of college students to decide the pertinence of time, instructions and items. No suggestions were made.
Inter-Rater Reliability Study [TOP]
As mentioned before, ECG Test is composed of several indicators using different punctuation criteria (dichotomous and polytomous). For dichotomous items, the examiner must value each indicator according to the presence-absence categories of the graphic attribute in the production. For polytomous items, the examiner must indicate, in an ordinal scale from 0 (abscence) to 9 (presence), the level of presence of the indicator, following key scores criteria. According to Drisko and Maschi (2016), consistency between scorers is often significantly superior when dichotomous scales are used, compared to ordinal scales. Taking into account this aspect, in order to improve the scoring process, original scoring criteria (dichotomous and polytomous) were modified, unifying them under a dichotomous scale (1 presence, 0 absence). That decision facilitated the scoring of every indicator, calculating scores regarding the number of stimuli where each one was present. This way, the whole range included 10 possible values, from zero – indicator being absent at every figural fragment –, to 9 points – indicator being present in every single figural fragment. Hence, a score equal to zero for an indicator was achieved when the presence of this indicator was not verified in any of the 9 figural fragments. If, for instance, its presence was verified in only one figural fragment, score would be equal to one, two for two figural fragments, and so on. Using this criterion the registration of the presence of some indicator in the 9 figural fragments became possible and easier. This new dichotomous scale for scoring reduces ambiguity as well as the time allocated to complete the scoring process, making it simpler and avoiding the examinees’ tendency to respond using central or extreme scale points (Morales Vallejo, 2006). As a result of that decision, only 9 of the 12 original indicators were retained and assessed, since indicators such as Sense of Humour, Graphic Fluency and Graphic Creativity were not adjusted to the new response scale. The Sense of Humour indicator refers to the presence-absence of hilarious elements which, by the way, were not defined with enough accuracy in the original version. Thus, the standardization of this indicator seems difficult in view of its subjectivity. That which can be hilarious for some person, could not cause the same effect in others. Besides, as the author states, although the Sense of Humour indicator could be frequently associated to creativity, it is not a decisive aspect in the concept (De la Torre, 2006). On the other hand, the exclusion of the Graphic Fluency indicator is explained by its dependence on the time employed to complete the activity in every case. Hence, the change made for this study concerning the time to solve the test (10 minutes), also makes the Sense of Humour scoring irrelevant. As for Graphic Creativity indicator, as mentioned above (Method part), it has been eliminated because the score did not depend directly on the examinee’s production, but it was established from an interview with him or her, which was not developed in the study, considering the availability of students and classes.
Referring to inter-rater reliability, 20 students were examined and their sheet answers were scored by three independent scorers with psychometric expertise. The participation of only three experts is enough for this assessment since the scale analysed is dichotomous (Kilem, 2012). Experts were provided with a file containing a brief of the theoretical model which bases the scale, as well as amplified instructions for scoring.
Construct Validity Evidences and Internal Consistency Studies [TOP]
350 college students were examined using ECG and CREA in order to analyse convergent validity evidences and the association between every ECG indicator and CREA total score. Using the same sample, a confirmatory factor analysis was calculated, allowing the comparison of the one-dimension-9-indicator model and that obtained in the convergent validity study (see Results below).
Test-Retest Reliability Study [TOP]
Using the scale version resulting from the above, two examinations with ECG, separated by 30 days were developed with the same sample.
Data Analysis [TOP]
Every analysis was performed on the total scores of ECG as input variables since the hypothesized one-dimension of the concept graphic creativity (De la Torre, 2006). They were calculated by adding every item score. Then, the study employed analyses designed for continuous variables. All analyses used SPSS 21 (IBM Corporation, 2012), except confirmatory factor analysis, which was calculated by LISREL 8 (Scientific Software International, 2006).
Inter-Rater Reliability Study [TOP]
Correlations between scores were calculated to analyse the inter-rate consistency when interpreting instructions for the scoring process. An intra class correlational coefficient (ICC) was calculated, as suggested by Dubé (2008), employing interpretation criteria posed by Landis and Koch (1977).
Construct Validity Study [TOP]
Following previous analyses applied in the adaptation of the Torrance Test of Creative Thinking – TTCT figural form – (Torrance, 1974), a convergent validity study and a confirmatory factor analysis were conducted (e.g. Clapham, 2004; Olivera et al., 2009).
Convergent validity evidences study. The association between scores for indicators of ECG and the CREA score were analysed. Spearman’s rho coefficients were calculated, in view of the non-compliance of the normality assumption for the variables.
Confirmatory factor analysis. According to the findings described before, indicators significantly associated to CREA score (verbal creativity) were taken into account, in order to examine if they converged significantly towards only one latent variable (graphic creativity), then allowing the calculation of a total score for ECG. This new model, empirically obtained, was compared to the original one (one-dimension-9-indicator), testing their fit to empirical data.
Internal Consistency Study [TOP]
Cronbach’s Alpha coefficient was employed since indicators were continuous.
Test-Retest Reliability Study [TOP]
ECG measure stability was analysed correlating scores resulting from both examinations. A Pearson’s r coefficient was calculated, given the compliance of the normality assumption in this case.
Results [TOP]
Face Validity Evidences Study [TOP]
No suggestions were gathered from students regarding items, instructions or time. Therefore, no changes were introduced.
Inter-Rater Reliability Study [TOP]
Total scores from each one of the three scorers were correlated. An intra class correlational coefficient (ICC) was calculated, obtaining a statistically significant association. Table 2 shows indexes corresponding to each indicator.
Table 2
Inter-Rate Reliability. Intra-Class Correlational Coefficients for the 9-Indicator Model.
| Indicator | ICC | 95% CI [LL, UL] | p |
|---|---|---|---|
| Resistance to Closure | .752 | [.406, .900] | <.001 |
| Figurative Resignification | .756 | [.497, .895] | <.001 |
| Originality | .303 | [-.122, .644] | .048 |
| Graphic Skills | .798 | [.568, .914] | <.001 |
| Elaboration | .446 | [-.204, .767] | .067 |
| Linear Connectivity | .552 | [.119, .801] | .009 |
| Expansive Connectivity | .308 | [-.123, .649] | .050 |
| Thematic Connectivity | .960 | [.916, .983] | <.001 |
| Fantasy | .949 | [.893, .978] | <.001 |
Note. CI = confidence interval; LL = lower limit of the confidence interval; UL = upper limit of the confidence interval.
Construct Validity Evidences and Internal Consistency Study [TOP]
Convergent Validity Evidences Study [TOP]
Considering that both ECG and CREA were designed to assess creativity, ECG’s 9 indicators – Resistance to Closure (Rc), Figurative Resignification (Fr), Originality (Or), Elaboration (El), Linear Connectivity (Lc), Thematic Connectivity (Tc), Expansive Connectivity (Ec), Fantasy (Fa), Graphic Skills (Gs) – were correlated to CREA’s score, in order to analyse convergent validity aspects. The association between each indicator and the CREA test was analysed using Spearman’s rho. Statistically significant covariances were found in the case of 4 indicators (Table 3).
Table 3
Correlations (Spearman’s rho) between ECG Indicator and CREA Score.
| Statistic | ECG Indicator
|
||||||||
|---|---|---|---|---|---|---|---|---|---|
| Rc | Fr | Or | El | Lc | Tc | Ec | Fa | Gs | |
| rho | .150 | .232 | .204 | .035 | .017 | .042 | -.001 | .028 | .120 |
| p | .005 | <.001 | <.001 | .519 | .756 | .436 | .987 | .600 | .025 |
Note. Rc = Resistance to Closure; Fr = Figurative Resignification; Or = Originality; El = Elaboration; Lc = Linear Connectivity; Tc = Thematic Connectivity; Ec = Expansive Connectivity; Fa = Fantasy; Gs = Graphic Skills.
Following former research (e.g. Alfonso, Cantero, & Melero, 2009; Garaigordobil Landazabal & Pérez Fernández, 2004; Hargreaves & Bolton, 1972) convergent validity evidences studies on creative variables usually obtain statistically significant correlations with weak magnitudes. These low indexes could be indicating that the variables measured are not completely similar, showing a strong tendency to behave independently. This seems to make sense when it is considered that both tests, even assessing creative processes, employ different expressions (graphic and verbal). These results lead to hypothesise that these ECG 4 indicators which obtained significant associations with CREA’s score – being it a test already analysed accounting validity evidences in local population – could be the indicators able to explain graphic creativity in a better way. In order to examine if the one-dimension-4-indicator model empirically obtained explains graphic creativity more accurately compared to the one-dimesion-9-indicator model, a confirmatory factor analysis was developed to observe each one’s fit. The purpose rests in analysing if those 5 indicators which have not obtained a significant association to CREA’s score in the converging validity study must be definitely excluded from the model.
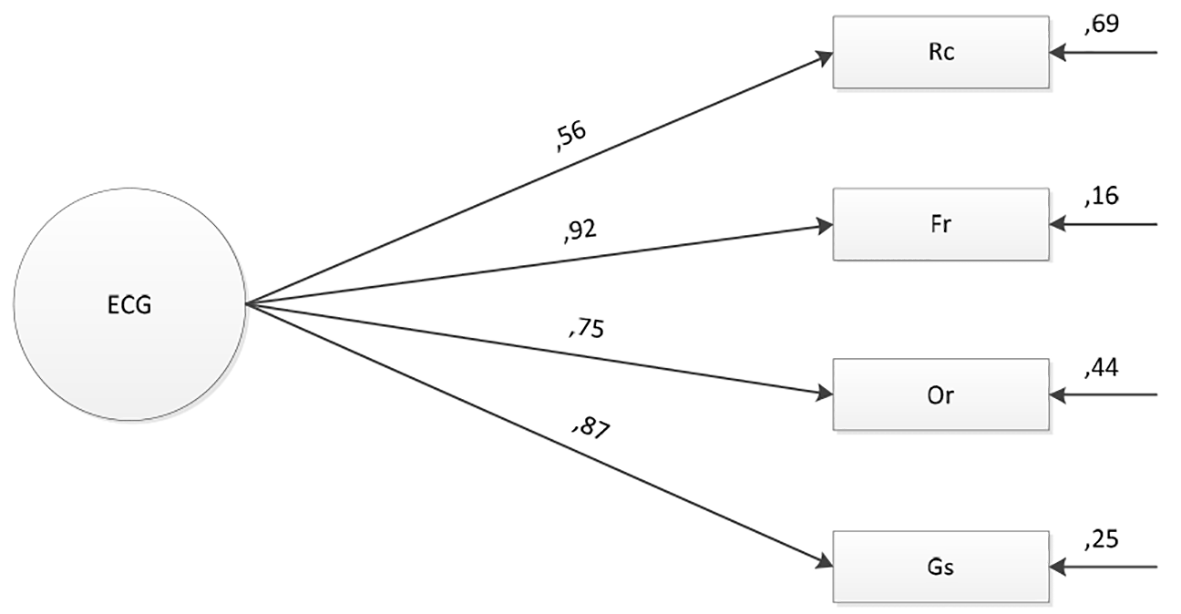
Confirmatory Factor Analysis [TOP]
Comparing the one-dimension-4-indicator model versus the original one-dimension-9-indicator model to establish which one showed a better fit to empirical data (Figures 1 and 2Figure 2), a maximum likelihood robust (MLR) arose as the first choice regarding the continuous character of data. However, considering the lack of multivariate normality assumptions compliance, the diagonal weighted least squares (DWLS) was best the alternative, maintaining the same conditions of MLR (Mîndrilă, 2010).
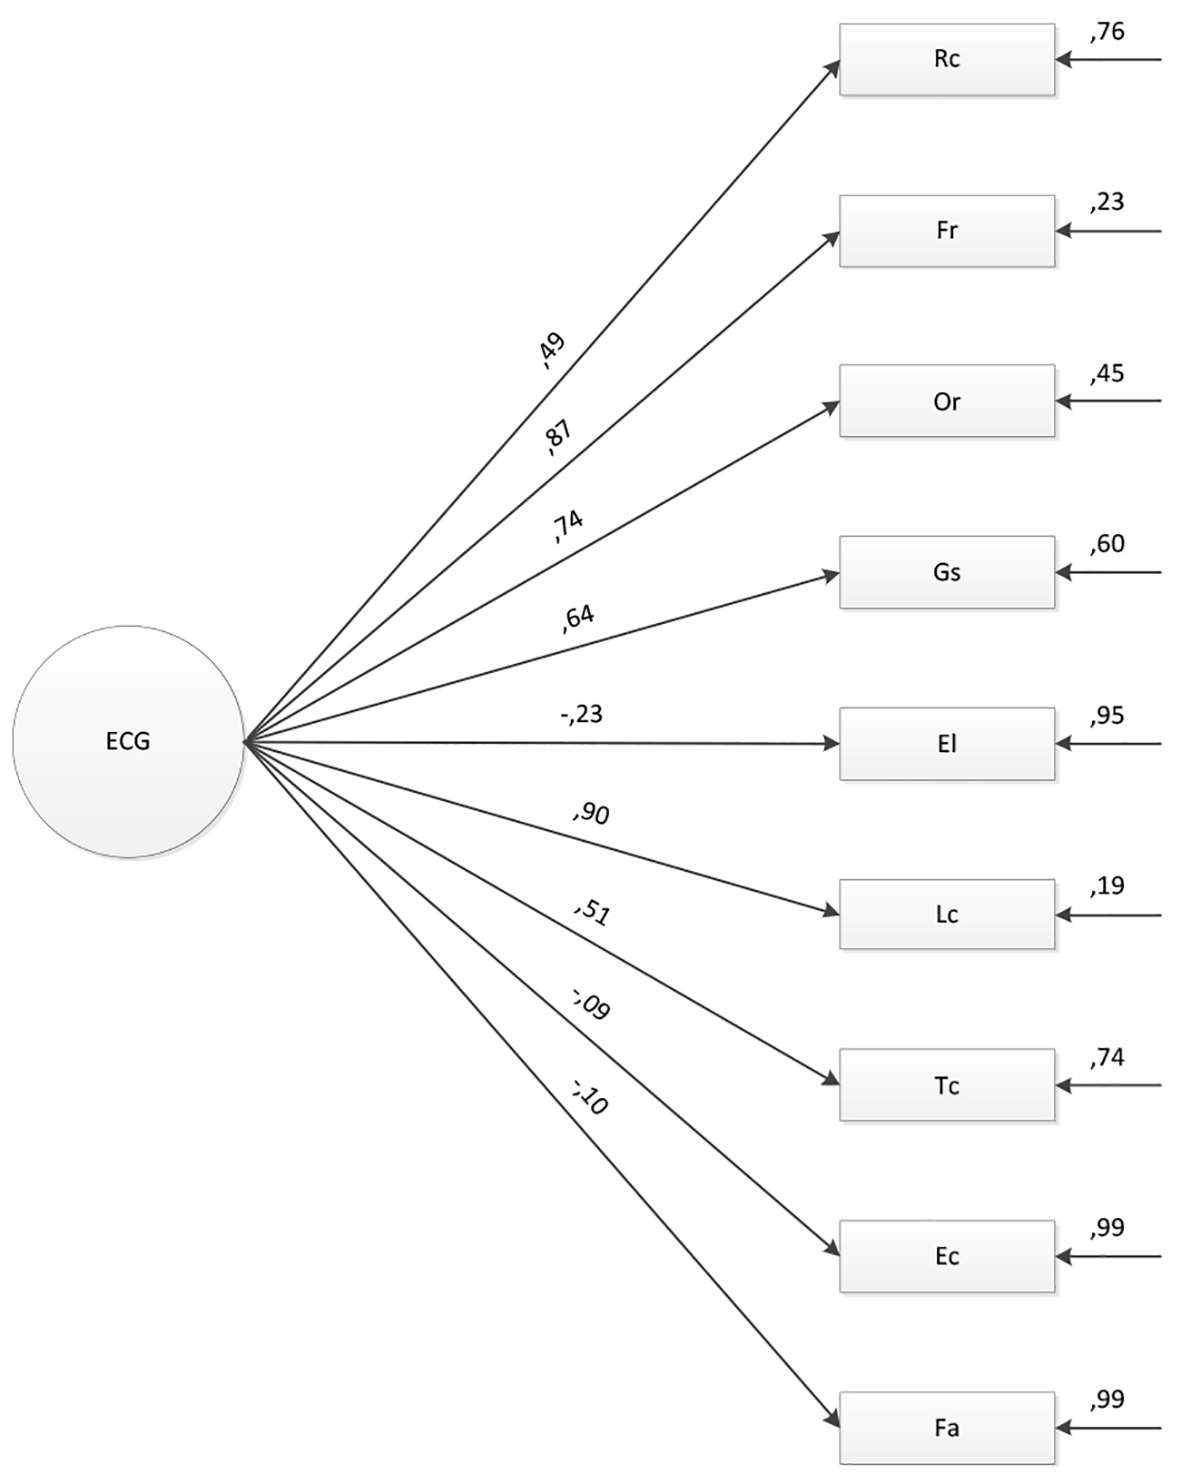
First, estimated parameters for both models were examined. Infringing equations were not observed in the one-dimension-4-indicator model. Nevertheless, the one-dimension-9-indicator model showed 3 Heywood cases (negative estimated variances). These values were maintained without any statistical treatment since some investigations have shown statistics such as chi square are not significantly affected by infringing equations (Chen, Bollen, Paxton, Curran, & Kirby, 2001). On the other hand, this type of errors could be interpreted as an indicator of a better fit for the one-dimension-4-indicator model, guaranteeing greater coherence between the observed variables and the latent ones, since it achieved a good theoretical and empirical identification (Oliver, Tomás, & Hontangas, 1999; Varela Mallou, Abalo Piñeiro, Rial Boubeta, & Braña Tobio, 2006).
To assess the adequacy of both models, various fit indexes were employed following authors’ recommendations (e.g. Holgado Tello, Chacón Moscoso, Barbero García, & Vila Abad, 2010; Jöreskog & Sörbom, 1999; Kline, 2005). χ2, GFI (Goodness of Fit Index), CFI (Comparative Fit Index), AGFI (Adjusted Goodness of Fit Index), as well as SRMR (Standardized Root Mean Square Residual), since the last is not affected by the sample size avoiding fit overestimations in small samples (Manzano Patiño & Zamora Muñoz, 2009).
Table 4 summarizes values and shows a better fit for the one-dimension-4-indicator model compared to the one-dimension-9-indicator model. GFI, CFI and AGFI indexes were adequate for the one-dimension-4-indicator one (> .90) whereas none of those indexes achieved the minimal value in the one-dimension-9-indicator case. As for SRMR, only the one-dimension-4-indicator model got appropriate values (between 0 and .08), while these results were not appropriate in the case of the 9-indicator model.
As for parsimony indexes, PGFI favoured the one-dimension-9-indicator model whereas PNFI was better for the 4-indicator one. The difference of .08 between PNFI values, being it within the standard values (.06 to .09), allows hypothesizing substantial changes between them (Lévy Mangin, Martín Fuentes, & Román González, 2006). Due to PNFI and PGFI values did not favoured the same model, CAIC index (Consistent Version of Akaike Information Criterion) was analysed. CAIC’s calculation contemplates the sample size, thus obtaining results which are independent from that feature (Hooper, Coughlan, & Mullen, 2008; Schermelleh Engel, Moosbrugger, & Muller, 2003). Since small coefficients indicate a higher parsimony, results seem better for the one-dimension-4-indicator model.
The analysis of the estimated parameters showed that all of them were significant for the 4-indicator model, and no infringing equations were found. The 9-indicator model showed 5 non- significant parameters and 3 Heywood cases (variances estimated as negative). All these results offer evidence that shows a better fit of the one-dimension-4-indicator model to empirical data.
Internal Consistency Study [TOP]
Since the indicators integrating the test used a continuous scale, a Cronbach’s Alpha coefficient was the choice, obtaining an index of .83.
Test-Retest Reliability Study [TOP]
The resulting scale, obtained by means of the construct validity evidences study was examined in terms of temporal stability. Peason’s r was calculated to correlate the values of the first and the second examination, obtaining a significant (p < .01) though not optimal result of .59.
Discussion [TOP]
Psychometric features of ECG Test were analysed in order to adapt a graphic measure of creativity to local population. As face validity analysis did not gather any suggestion concerning instructions or items, the original format was maintained. Henceforward the general appearance of the scale as well as the incorporation of a time limit to respond items seemed adequate, without any inconsistencies detected when examinees were developing the activity. Criticism towards time limits is well known since creative processes do not always manifest in activities developed under pressure (De la Torre, 1991; Lemons, 2011). However time limits improve standardization of the examination setting, allowing the comparison within individual productions. Even considering time limits as acting against originality (Cerda Gutiérrez, 2006) a counterargument poses that fluency, as a major feature of the concept, assumes the emergence of a large number of ideas in short periods, therefore favouring creative persons (Weisberg, 2006).
Concerning inter-rater reliability study, it is noteworthy to mention that it intends to eliminate errors generated by scorers’ subjectivity, as well as to improve, if necessary, instructions for scoring. This procedure is imperative when scoring highly depends on the examiner’s judgment (Anastasi & Urbina, 1998; Aragón & Silva, 2004). Following this purpose, inter-rater reliability was analysed, finding significant and almost perfect values (.81 - 1) for Thematic Connectivity and Fantasy indicators, substantial coefficients (.61 - .80) for Resistance to Closure, Figurative Resignification and Graphic Skills, moderated magnitudes (.41 - .60) for Linear Connectivity, and fair values (.21 - .40) for Originality. As for Elaboration and Expansive Connectivity, they did not achieve significance. Results show that scores obtained by ECG can be interpreted with an acceptable level of confidence, since they are not significantly affected by the scorer’s subjectivity. However, scoring keys must be carefully revised and tested at least, once again, reproducing the same procedures. Attention must be focused especially on the Originality indicator, in order to improve scoring, reducing error variance due to scorers.
Criterion validity evidences between ECG indicators – Resistance to Closure, Figurative Resignification, Originality, Elaboration, Linear Connectivity, Thematic Connectivity, Expansive Connectivity, Fantasy, Graphic Skills – and the CREA total score showed significant correlations only in 4 of the 9 under examination. They were Resistance to Closure (rho = .150; p = .005), Figurative Resignification (rho = .232; p = .000), Originality (rho = .204; p = .000), and Graphic Skills (rho = .120; p = .025). Although associations were statistically significant and positive, all of them were low, indicating weak relationships between ECG graphic creative indicators and CREA scores. Despite following a theoretical criterion they were retained in the scale since these results seemed adequate in view of former studies examining different kinds of creativity (graphic and verbal, for instance) that also obtained significant coefficients close to zero. Following authors (e.g. Alfonso, Cantero, & Melero, 2009; Garaigordobil Landazabal & Pérez Fernández, 2004; Hargreaves & Bolton, 1972), statistical significance responds to the fact that both tests measure the same concept (creativity), whereas the weakness of the associations illustrates the use of different ways of expression thereof.
On the other hand, indicators retained after the convergent validity study – Resistance to Closure, Figurative Resignification, Originality, Graphic Skills – integrated a model which subsequently showed its superiority compared to the original 9-indicator one – Resistance to Closure, Figurative Resignification, Originality, Elaboration, Linear Connectivity, Thematic Connectivity, Expansive Connectivity, Fantasy, Graphic Skills. The 4-indicator model not only verified a better fit to empirical data, but it resulted better in terms of parsimony, being the call over its rival, composed of 9 indicators. This way, the 4 indicators converge into a latent variable, allowing the calculation of a total score representing graphic creativity. This finding arises as logical since De la Torre (2006) posed the hypothesis of three operations – perception, integration and expression – defining the level of graphic creativity in the individual. Consequently he conceived each indicator as ways of examining the degree of interaction within those three operations.
Regarding reliability studies, these convergent 4 indicators mentioned above obtained an adequate internal consistency (Crobach’s Alpha = .83).
Temporal stability of scores, even acceptable (r = .59), did not reach optimal values. Results run in the same sense of former test-retest studies developed with similar scales (Mohamed, Maker, & Lubart, 2012; Rudowicz, 2004; Urban & Jellen, 1986; Wolanska & Necka, 1990). This moderate stability could be a direct outcome of the inter-rater reliability –those coefficients, although adequate, do not reach optimal values (> .80). Subjectivity could be affecting scoring in the first testing step as well as in the retest phase (Gwet, 2012). Moreover, criticism on creativity measurement appears as a matter of interest, because it is not steadily expressed in the same individual, appearing only in some specific moments. Examining individuals in the precise moment when they are experiencing the phase when creativity manifests seems unlikely (Laime Pérez, 2005). In view of this, results for test-retest study could be explained by the unequal manifestation of creativity in a certain period of time. Ulterior analyses conducted with new and wider samples will contribute to add evidences in favour or against these arguments.
In regard to limitations, besides the above mentioned issues presented at the convergent validity analysis – low coefficients due to CREA measures verbal creativity, the sample size must be considered. The number of participants whose responses were analysed by confirmatory factor analysis, even not influencing directly on results, hinders the possibility of a cross-validation procedure. This issue, added to the inherent instability which distinguishes creative processes, restricts in some degree these conclusions, which must be revised according to new results.
In sum, this research analysed psychometric features of the Test de Evaluación de la Creatividad Gráfica (ECG) – Assessment of Graphic Creativity, which retained only 4 indicators – Resistance to Closure, Figurative Resignification, Originality, Graphic Skills – from the original 9 ones. A moderate temporal stability in measures was found in a 30-days interval, as well as good inter-rater reliability. That leads examiners to develop adequate interpretations of scores, improving scoring objectivity and the assignation of appropriate psychological significance to results in individual assessments. Construct validity evidences study found an adequate fit of the 4-indicator model to data, supporting a total score representing graphic creative skills. This way the assertion about validity evidences and reliable measures generated by means of the scale used in college students from Buenos Aires appears to be reasonable.
This scale, suitable to be used complementing CREA Test, is currently available to be employed by educational psychologists, facilitating a more complete measure of the creative process.
