
 Download PDF
 Contents
 This is an open access article distributed under the terms of the Creative Commons
Attribution License (
This is an open access article distributed under the terms of the Creative Commons
Attribution License (Mood, as a quality of feeling at a particular time or even a persistent emotion influencing our thoughts and actions, is important for personal and social adjustment. The assessment of such states in an efficient and accurate manner is a type of Holy Grail for clinicians. A solution to this quest has even greater value where there are difficulties in answering due to literacy problems or neurological conditions such as aphasia (Arruda et al., 1996a; Kontou, Thomas, & Lincoln, 2012). The resort to visual analogue scales as a self-estimate of gross mood states had its origins around 98 years ago in personnel and industrial psychology (Hayes & Patterson, 1921), but has been slow to find recognition in mainstream psychological testing even though it has been used readily in medicine or health with the assessment of pain (Haefeli & Elfering, 2006), the rehabilitation of stroke patients (Vickery, Evans, Lee, Sepehri, & Jaheen, 2009) or temperament (Yeung & Wong, 2019). Visual analogue approaches began life as graphic rating scales and the Visual Analog Mood Scales (Stern, 1997; Stern, Daneshvar, & Poon, 2010) are part of this zeitgeist. This paper reviews and evaluates the Visual Analog Mood Scales. The format and nature of the scales is reviewed together with the development, standardization and scoring. The findings of validity and reliability are also appraised and a holistic evaluation of the utility of a visual analogue assessment of mood is outlined. The purpose is to examine their utility for personal assessment, psychological interventions and mood research.
The Format and Nature of the Visual Analog Mood Scales [TOP]
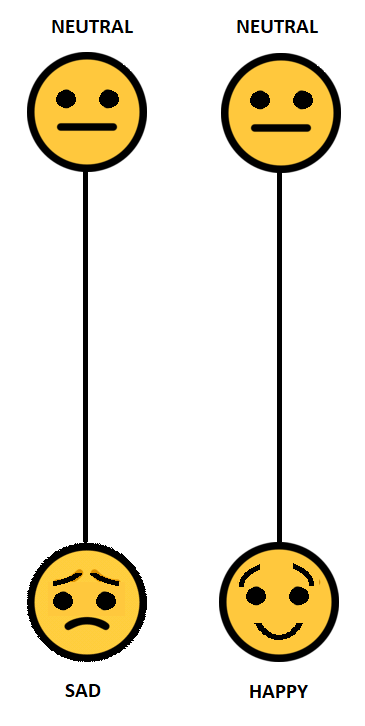
The Visual Analog Mood Scales were developed originally by Stern (1997) and his co-workers for clinical use in the assessment of mood for neurological cases (e.g., aphasia, stroke) but have also found application in clinical settings as a screening tool (Bennett, Thomas, Austen, Morris, & Lincoln, 2006). There is no substantive theory of mood that underlies the Visual Analog Mood Scales other than to provide an assessment of eight clinically relevant, specific, internal mood states: afraid, confused, sad, angry, energetic tired, happy or tense. On the whole it appears to be phenomenological rather than providing a bio-medical or neuropsychological substrate for moods. The eight scales are presented each on a single page and are unipolar dimensions, such as “neutral-sad” or “neutral-afraid”. Each mood state has an ideogram or face (what we would now call an emoji) at the bottom portraying an emotion. There is an unbroken vertical line of 100mm from the bottom of the page to another ideogram or face with the word “Neutral” at the top of each page. A sample scale is illustrated in Figure 1. Six scales relate to a negative mood (afraid, confused, sad, angry, tired or tense) and two relate to a positive mood (energetic, happiness). The test taker marks the level of their mood and this is measured in millimeters from the upper edge or neutral position. The Visual Analog Mood Scales are designed for adults aged 18 years and over. Completion of the task is not demanding as it is largely non-verbal or pictorial in its presentation.
Empirical Studies Involving the Visual Analog Mood Scales [TOP]
The following section provides a summary of empirical studies (including scoring, reliability and validity) related to the Visual Analog Mood Scales. This was derived from a search of the literature in PsycINFO using the search term “Visual Analog Mood Scales”. This yielded 35 citations of which 24 provided data of some sort on the use of the scales in empirical research.
Standardisation and scoring [TOP]
The standardisation sample included 579 adults aged 18-94 years (Nyenhuis, Yamamoto, Stern, Luchetta, & Arruda, 1997). The sample was non-representative, comprising 21% undergraduate students (N = 124) and a convenience sample of 455 from church and community groups (Stern, 1997). Two norm groups with linear transformation to T-scores were produced from the 579 adults – one for younger adults (123 male and 127 female) and one for older adults (76 male; 99 female); however, Leung (2003) considered that the standardisation group was not representative of the general population.
An overall mean and standard deviation for the entire standardisation group (N = 402) was determined for the reader: Afraid, M = 11.7, SD = 16.6; Confused, M = 14.8, SD = 19.6; Sad, M = 16.2, SD = 20.7; Angry, M = 14.9, SD = 19.7; Energetic, M = 61.4, SD = 27.4; Tired, M = 39.6, SD = 29.0; Happy, M = 72.6, SD = 26.4; and Tense, M = 23.2, SD = 24.3. The mean values with error bars of one standard deviation are shown in Figure 2.
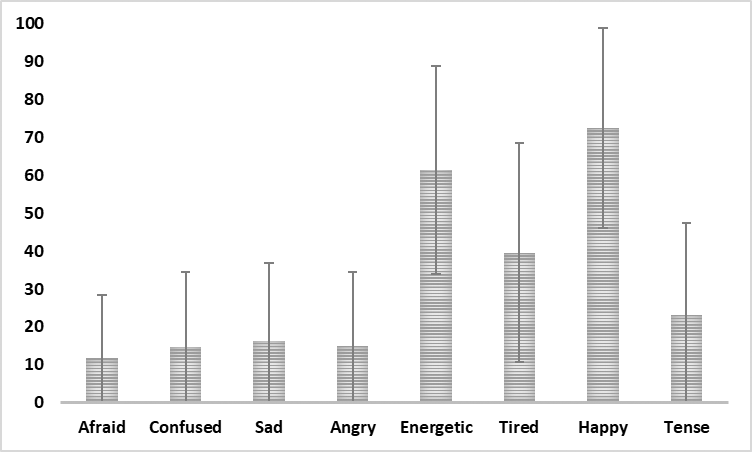
Figure 2
Mean score on VAMS scales from the combined standardisation groups (N = 440) with error bar of one standard deviation.
In four studies a total score across all the eight scales has been used. Nyenhuis et al. (1997) were amongst the first to combine the raw scores. This was done as part of the standardisation for the Visual Analog Mood Scales, but these findings are not reported in the user guide for the scales (Stern, 1997). Briefly, they calculated a composite score with the two positive valence scales (Happy and Energetic) reversed. This yielded an overall mean of -8.8 (SD = 130.1). On the other hand, Bennett et al. (2006) reported a median score of 393.5 for 50 healthy older adults and a median score of 244 for stroke patients. It is possible that no allowance was made in the total score for the opposite direction (and scoring) of the Happy and Energetic scales. It seems likely because the internal consistency of the Visual Analog Mood Scales for the healthy older adults (N = 50) was .73 without the Happy and Energetic scales compared to .45 for all eight scales. For stroke patients, the internal consistency on the six scales was also higher (Cronbach’s alpha = .81). Kontou et al. (2012) developed a revised Visual Analog Mood Scales with the scoring for Energetic and Happy reversed. The coefficient alpha for the total mood scale was .74 for healthy adult group (N = 50) and .80 for an aphasic group (N = 71). They reported that the total score correlated moderately with the Hospital Anxiety and Depression Scales, .59 for anxiety and .49 for depression. Finally, Vickery (2006) investigated moods in a stroke population and used a total mood summary score made up of the sum of the T-scores on the scales Afraid, Confused, Sad, Angry, Tired and Tense minus Happy and Energetic.
Reliability [TOP]
The reported test-retest reliability for a sample of 75 undergraduate students across a 15-minute time period varied from .49 for Sad to .76 for Tired. For 27 stroke patients across a 20-minute period, the test-retest coefficients varied from .43 for Confused to .84 for Afraid (Arruda, Stern, & Somerville, 1999). The most recent evaluation of reliability was that of House, Arruda, Andrasik, and Grazzi (2012), who reported coefficients for a sample of 60 across a 45-minute period ranging from .55 for tense to .87 for confused. In summary, the range of the test-retest correlations for seven of the eight scales across three studies is: Afraid .69 to .84, Confused .43 to .87, Sad .45 to .83, Angry .71 to .75, Energetic .44 to .81, Tired .60 to .63 or Happy .67 to .73 (Tense - insufficient data). These coefficients are considered low for any high-stakes decisions.
Validity [TOP]
Validity of the results from the Visual Analog Mood Scales has been assessed mainly through concurrent validity studies as well as examination of the multi-trait multi-method correlation matrix when used with other measures as well as one factorial study. Altogether, there have been nine studies of the concurrent validity of the Visual Analog Mood Scales and the key findings are reviewed in the following paragraph.
Concurrent validity for 75 students was established in correlations of seven scales (the Tense scale was not included) with corresponding scales from the Profile of Mood States (McNair, Lorr, & Droppelman, 1981). The concurrent validities ranged from .33 for Sad to .66 for Energetic. In a subsequent study (N = 140 undergraduates) the median correlation for six VAMS scales with the Profile of Mood States was .68. In that same group the Sad scale correlated .53 with the Beck Depression Inventory (Beck & Steer, 1987). For a group of 400 healthy adults, the Sad scale correlated .54 with the Beck Depression inventory and the Tense scale correlated .66 with the State Trait Anxiety inventory (Spielberger, Gorsuch, & Lushene, 1970). For the VAMS dimensions of happy, sad, angry and tense, there were positive correlations (.49 to .82) with corresponding dimensions on the Life Interests Values Cards (Haley, Womack, Helm-Estabrooks, Caignon, & McCulloch, 2010) for 23 patients with aphasia. Bennett et al. (2006) investigated the concurrent validity of the VAMS (less the Happy and Energetic scales) with the Hospital Anxiety and Depression Scale. They indicated concerns about the reverse direction of the Happy and Energetic scales: “It was noted during testing that participants failed to notice that the polarity of these scales were reversed. Despite verbal comments to indicate consistency in their mood level, they marked the item as if neutral were always at the top” (Bennett et al., 2006, p. 374). A summary of the results from nine concurrent validity studies is provided in Table 1 and indicates that the range of validity coefficients is wide across all scales.
Table 1
Concurrent Validity Findings Across Each of the Eight Scales
| First author | Year | N | Measure | Afraid | Confused | Sad | Angry | Energetic | Tired | Happy | Tense |
|---|---|---|---|---|---|---|---|---|---|---|---|
| Arruda | 1996b | 25 | HDRS | .58 | .61 | .66 | .28 | -.58 | .56 | -.50 | |
| Arruda | 1996b | 25 | CES-D | .64 | .47 | .49 | .48 | -.59 | .33 | -.62 | |
| Arruda | 1999 | 41 | POMS | .78 | .49 | .72 | .80 | .58 | .68 | ||
| Haley | 2015 | 23 | LIV | .49 | .57 | .82 | .57 | ||||
| House | 2012 | 60 | POMS | .12 | .55 | .49 | .44 | .33 | .39 | ||
| Nyenhuis | 1997 | 400 | POMS | .39 | .64 | .69 | .55 | .63 | .67 | .62 | |
| Stern | 1997 | 75 | POMS | .34 | .43 | .33 | .66 | .66 | .64 | ||
| Stern | 1997 | 140 | POMS | .54 | .51 | .72 | .65 | .71 | .74 | ||
| Temple | 2004 | 31 | POMS | .55 | .53 | .53 | .72 | .37 | .55 | .52 | |
| Minimum correlation, Maximum correlation | [.12, .78] | [.43, .64] | [.33, .72] | [.28, .80] | [.33, .71] | [.33, .74] | [.50, .82] | [.52, .62] | |||
Note. CES-D = Modified Center for Epidemiological Studies – Depression Scale; HDRS = Hamilton Depression Rating Scale; LIV = Life Interests and Values Cards; POMS = Profile of Mood States. Energetic and Happy scales may have been reversed in scoring in some studies leading to negative correlations.
The convergent and discriminant validity of the VAMS vis a vis the Profile of Mood States has been reported in the manual for the Visual Analog Mood Scales (Stern, 1997) as well as three other studies (Arruda et al., 1996a; Arruda, Stern, Legendre, 1996b; Temple, Stern, Latham, Ruffolo et al., 2004). This approach was based on an analysis of the multitrait-multimethod matrix. Arruda et al. (1996a) studied an aphasic group (N = 35) and reported a monotrait-heteromethod mean correlation of .54. In 1999, Arruda et al. extended their studies to a stroke sample (N = 41) and reported a monotrait-heteromethod mean correlation of .68 with the Profile of Mood States, whereas Temple et al. (2004) reported a mean convergent validity of .53 for 31 dementia patients. For the standardization sample (N = 400), Stern (1997) indicated convergent validity from .39 to .67 with the Profile of Mood States. Although this evidence is suggestive it is somewhat limited in (a) its scope in terms of clinical groups (i.e., aphasia, stroke and dementia), (b) its depth in that it relates to only one standard of comparison the Profile of Mood States, (c) its limitation to only studies from the USA, and (d) its restricted extent in terms of sample sizes (median N = 41).
The final validity evidence comes from an exploratory factor analysis of the eight scales. Nyenhuis et al. (1997) suggested two principal components “negative mood” and “energy” accounting for 61.8% of the total variance. This is consistent with the content or face validity of the scales. A more promising line of evidence, development and application of the Visual Analog Mood Scales is their use to monitor progress or the results of therapeutic or other interventions.
Interventions and the Visual Analog Mood Scales [TOP]
The VAMS is promoted as a screening instrument and two interpretive uses of the scores are listed, namely (a) screening for mood disturbance; or (b) tracking changes in mood over time. The Visual Analog Mood Scales have been used in six implementation studies and the findings are summarized briefly in Table 2.
Table 2
Use of the VAMS in Intervention Studies
| First author | Year | Country | N | Condition | Intervention and findings |
|---|---|---|---|---|---|
| Arruda | 1996b | USA | 25 | Depressive disorder | 1.VAMS (sad, happy, tired, energetic) most sensitive to therapeutic effects of ECT 2.VAMS correlated with psychiatrist’s Clinical Global Improvement (sad, happy, tired, energetic) |
| Barton | 1993 | USA | 29 | Normal volunteers | No effect of lithium on mean VAMS scores for “normal” subject in week 5 of double blind placebo controlled crossover study |
| Corsten | 2015 | Germany | 27 | Aphasia | Used a biographic-narrative intervention over 10 weeks; T-scores for Confused and Tense scales decreased significantly from baseline for narrative interviews |
| Porcherot | 2015 | France | 277 | Restaurant clients | Investigated effect of aperitif consumption on mood; raspberry Kir reduced significantly tense and anxious moods |
| Thomas | 2013 | UK | 105 | Stroke | VAMS sad scale reflected allocation to usual care versus behavioural therapy for stroke |
| Vickery | 2009 | USA | 120 | Stroke | Mean VAMS composite score based on six negative moods was 346.8 (SD = 83.5) on admission and 312.9 (SD = 76.9) on discharge |
These studies covered electroconvulsive therapy (Arruda, Stern, & Legendre, 1996b), the effect of lithium (Barton et al., 1993), narrative intervention (Corsten, Schimpf, Konrad, Keilmann, & Hardering, 2015), restaurant clients and aperitif consumption (Porcherot, Petit, Giboreau, Gaudreau, & Cayeux, 2015), behavioural therapy for stroke (Thomas, Walker, Macniven, Haworth, & Lincoln, 2013) and stroke rehabilitation (Vickery et al., 2009). It was not possible to combine these results with a suitable or meaningful metric such as effect size, but the overall impression is that the scales are sensitive to treatment and interventions.
Conclusions [TOP]
As far back as 1997, Ahearn evaluated pictorial scales for the assessment of mood and concluded that they had value: “These scales are simple to complete, ensuring a high rate of compliance, and they have been shown to possess high reliability and validity. Provided that clear instruction is made to the patient, such scales can be used confidently to obtain helpful self-report information, particularly about the course and variability of illness from the patient's perspective” (Ahearn, 1997, p. 577). As a unique assessment method, the Visual Analog Moods Scales follow in this tradition. They enable (a) a description of a person’s functioning; (b) the diagnosis of problem areas; (c) to ascertain the need for therapy; and (d) even monitor the progress of an intervention on positive or negative moods. Yet, the Visual Analog Moods Scales first published just over 20 years ago have found limited application in psychological or health settings despite their potential. The reports are limited mainly to small sample sizes with clinical groups such as Parkinson’s (Foster et al., 2013), Alzheimer’s (Stern et al., 2004), stroke (Thomas et al., 2013), aphasia (Corsten et al., 2015) or dementia (Temple et al., 2004).
Although the eight scales form part of the Visual Analog Mood Scales booklet, there is no a priori justification for combining the results to produce an overall “mood” score. The conceptual nature of this overall mood is questionable. It may be reasonable, however, to discern an elevated mood level across the eight scales (with scoring reversed for the positive moods) but only as a broad indicator of the altitude of the prevailing emotional states. The adding together of eight different raw scores or even T-scores is not justified mathematically as there are no units of mood (Michell, 2005). There are also doubts about the value of the norms from the standardization group based on the comments of the review in the Mental Measurement Yearbook (Leung, 2003) and for this reason clinicians might be better advised to use the ordering of the raw scores (Cliff & Keats, 2003) with possibly 50 as an initial screening point for further clinical investigation of the negative moods.
The actual concurrent validity correlations that are cited in Table 1 do have greater meaning than one might imagine at first sight. The minimum concurrent validities for each scale (i.e., the second last row in Table 1) were related to real world criteria. Validities from meta-analyses and reviews (Meyer et al., 2001) are listed for comparison with the minimum concurrent validity correlations of the same value from the Visual Analog Moods Scales (Table 3). The comparisons are conservative and attest to the potential value of this approach to the assessment of mood, especially since the concurrent validities are not corrected for unreliability or range restriction.
Table 3
Comparison of the Lowest Concurrent Validity Coefficients for Each Visual Analog Mood Scale With Real World Validities
| VAMS minimum concurrent validity | VAMS scale | Equivalent real-world validities |
|---|---|---|
| .12 | Afraid | Family social support and lower blood pressure (Meyer et al., 2001, p. 130) |
| .28 | Anger | Effect of psychological therapy under clinically relevant conditions (Meyer et al., 2001, p. 131) |
| .36 | Energetic/Tired | Gender and self-reported assertiveness (Meyer et al., 2001, p. 131) |
| .43 | Confused | Loss in habitat size and population decline (r = .40) (Meyer et al., 2001, p. 131) |
| .49 | Sad | Weight and height for US adults (r = .44) (Meyer et al., 2001, p. 132) |
| .50 | Happy | Parental report of attachment to their parents and the quality of their child’s attachment (r = .47) (Meyer et al., 2001, p. 132) |
| .52 | Tense | Increasing age and declining speed of information processing (Meyer et al., 2001, p. 132) |
A holistic evaluation of the overall utility of the Visual Analog Mood Scales might also be considered in this conclusion. In 2016, Francis, McPheeters, Noud, Penson, and Feurer developed an 18-item checklist of evaluative criteria to assess patient reported outcomes that may be used to evaluate the strengths or weaknesses of different measures. This checklist has been adapted and applied to the Visual Analog Mood Scales and the results are summarized in Table 4. The scales meet at least two-thirds of the criteria in this evaluative approach. The major failings appear on this approach to be in the areas of reliability and validity. The prevailing inference is that the Visual Analog Moods Scales have promise as a non-verbal or quasi pictorial assessment of moods but no claim is made that the Visual Analog Moods Scales offer a full or complete representation of moods.
Table 4
Evaluative Checklist of the Operational Measurement Characteristics of the Visual Analog Mood Scales (After Francis et al., 2016)
| Conceptual Model | |
|---|---|
| Specified the construct? | No |
| Designated the intended population? | Yes |
| Sets out the expectation for a single or multiple dimension(s)? | Yes |
| Content Validity | |
| Involved the intended population in development of the scale(s)? | No |
| Involved content or subject matter experts in development of the scale(s)? | No |
| Outlined the method of item development (e.g., focus groups, interviews)? | No |
| Reliability | |
| Determined test-retest, internal consistency or parallel form reliability was determined? | Yes |
| Reported appropriate reliability (high stakes r ≥ .9; ideal r ≥ .8; minimal r ≥.7)? | No |
| Construct Validity | |
| Reported factor analysis or Rasch scaling? | Yes |
| Supported concurrent validity with other measures or real-world data? | Yes |
| Reported expected differences in results between identifiable groups? | Yes |
| Provided evidence of sensitivity to change? | No |
| Scoring & Interpretation | |
| Documented the scoring? | Yes |
| Planned for incomplete responses? | Yes |
| Offered details or norms or criteria for interpretation? | Yes |
| Respondent Burden & Presentation | |
| Reported a reasonable time required for assessment? | Yes |
| Specified the reading level? | Yes |
| Provided access to a copy of the measure? | Yes |
Turning now to the psychometric foundation of the scales, it is noted that the essential foundation of each of the Visual Analog Mood Scales is that of a self-estimate based on a single measure as opposed to an inventory with multiple sets of questions relating to a mood state. For some time, there has been a view about the inherent accuracy of self-perception (Bem, 1972) because individuals can be valid observers of themselves (Duval & Wicklund, 1972). In those contexts where there is no reason for disguise or concealment, Mischel (1977, p. 248) contended that “what the person tells us directly turns out to be as valuable an index as any other more direct sign”. Writing from a perspective of self-evaluation of personality characteristics, Burisch (1984, p. 225) went further and concluded: “if self-ratings are (a) directly communicable, (b) the ultimate in economy, and (c) also more valid than their questionnaire counterparts, then we will have to face the embarrassing question of just why we continue to construct personality inventories at all”.
Aside from the issue of the validity of the Visual Analog Mood Scales as self-estimates, there is a powerful argument for their utility. They have been applied in the assessment of difficult clinical groups in which other forms or methods of assessment would struggle. Although, the results to date inspire some confidence, the data supporting the validity or reliability of the findings is limited. There is some suggestion of validity through the effect of therapeutic interventions. In terms of scoring, there is no clear evidence of the advantage of T-scores or a norm-referenced interpretation, whereas a criterion-referenced approach might have more value. Patients with major depression or mild depression (N = 56) were used to establish a cut-off point of 50 raw score for the Sad scale in the manual for the scales (Stern, 1997). As a general rule, a clinical cut-off point of scores greater than 50 for the negative moods and less than 50 for the positive moods might be tested. The combination of ratings to form a total mood score is not supported at present as there is limited theoretical foundation for an overall mood concept. The elevation of the profile may have diagnostic significance but this has yet to be explored in detail.
There is scope for a substantial program of future research to build upon the findings of this evaluation. Nine potential theoretical and practical gaps in research related to the Visual Analog Mood Scales might involve: (a) standardization and the development of representative norms for clinical samples and the general population in order to enhance the utility of the results; (b) examination of whether raw scores or a transformation of raw scores has value for clinical interpretations; (c) examination of the value of analogue ratings as self-estimates within a theory of self-perception; (d) determining the specificity and sensitivity of the results for clinical groups (e.g., chronic pain, post-traumatic stress disorder, anxiety, depression, thought disorders, neuro-cognitive difficulties); (e) locating the eight mood scales within a theory of moods (positive and negative) or within a broader theory of personality (e.g., neuroticism, extraversion, openness to experience, agreeableness or conscientiousness); (f) provision of evidence of long-term test-retest reliability of moods as some of the studies used only 15-minute time intervals; (g) validation of the results in terms of prediction and consequential validity; (h) examination of aspects of administration such as any effects of the order of presentation of the scales; or (i) whether the graphics and presentation of the figures need to match the more modern emoji ideograms is a moot point and one for separate evaluation but worthy of consideration in any future review of the scales.
In summary, it is considered that the value of the Visual Analog Mood Scales is that they provide a standardized but also efficient assessment of feeling at a particular point in time. As expected, the available evidence is that the Visual Analog Mood Scales have some reliability and accuracy. They enable inferences about the moods relevant to personal or social adjustment and it is believed that they should have found greater application in psychological theory and research.
