Introduction [TOP]
Aggressive driving is a phenomenon, which exists in different countries of the world. High level of danger of aggressive driving was noted by organizations like WHO and UNO, which have initiated measures aimed at decreasing this phenomenon in the traffic environment (UNECE, 2004). In connection with this, during the seminar within the frames of the EEC (European Economic Committee) of the UNO, in relation to the topic of aggressive driving special attention was paid to human factors (United Nations Economic Commission for Europe [UNECE], 2004).
In connection with the topicality of this issue at the international level, this phenomenon was also singled out in Latvia; since 2004 a term “aggressive driving” has been introduced on the legislative basis (Ministru kabineta noteikumi 551, 2004). Monetary penalty is provided for this type of road traffic violation, as well as charge of penalty points. According to the adopted terminology, aggressive driving in Latvia means: “1) Execution of several consecutive violations connected with establishment of situations dangerous to the road traffic or situations putting obstacles in the way of it. 2) Vehicle driving in such way that a violation of the road traffic rules is committed and the hindrances for even flow of the vehicles are created; or interests of drivers of other vehicles are ignored (repeated change of driving lanes with outstripping, lead of several vehicles, which are in traffic jam or moving in a column on the wrong side, or the lane, which is meant for movement of passenger vehicles of public use, on the roadside, pavement, footway, bikeway or other places not meant for movement of vehicles” (Ministru kabineta noteikumi 551, 2004; Ministru kabineta noteikumi 840, 2006; Ministru kabineta noteikumi 69, 2009).
Aggressive driving is one of the most significant reasons for the road traffic accidents (UNECE, 2004). Considering the data of road traffic traumatism, considerable gender and age peculiarities can be noted. So, the main death cause in the world, which takes the first place in the cause of death rating, in the age group 15 to 29 years, is the Road transport traumatism (World Health Organization, 2008). This tendency is observed both at the world and at the European levels (Racioppi, Eriksson, Tingvall, & Villaveces, 2004; Sethi, Racioppi, & Mitis, 2007). Also, it must be noted that Road transport traumatism is one of the three leading mortality causes at the age to 44 years (World Health Organization, 2008).
Considering the sex peculiarities of this issue, it may be stated that three fourths of death cases as a result of the road transport traumas has taken place among men, besides, analogue proportion is observed in Latvia (Ceļu Satiksmes Drošības Direkcija, 2012; World Health Organization, 2008). It must be noted that severity of the road traffic accidents is directly connected with the mode of driving speed (Finch, Kompfner, Lockwood, & Maycock, 1994; Joint OECD/ECMT Transport Research Centre, 2006; Nilsson, 2004). Violations that are connected with speed, according to the Utah Safety Council’s data, are also observed among younger male drivers, and every third road traffic accident is the result of such violation (World Health Organization, 2012).
The age peculiarities in the drivers’ behavior are marked in all studies by Klein (1972). He emphasized the attention on young people. The researcher notes that, on one hand, young people show desire for self-expression, desire to match the status of a real man, which is manifested for them as hard and risky when driving a vehicle. On the other hand, they are under control of different social institutions and their self-expression is restricted. A vehicle in this case is a symbolic embodiment of freedom and self-expression (Klein, 1972). According to a Dutch researcher’s data, drivers – young men, unlike other people, behaved more aggressively on the crossroads as well (Hauber, 1980).
Krahé and Fenske (2002) found out that there were significant relationships between aggressive driving, Macho personality, age, and power of car. Lajunen (2001) studying association between road traffic accidents and personality variables like extroversion, neuroticism and psychoticism, found the following results. Extroversion correlated positively with the number of deaths on the roads, whereas neuroticism negatively correlated with the fatal road accidents. It should be noted that the researcher believed that occupational fatalities were very much related to deaths on the roads but not to dimensions of the personality.
Many researchers in the field of road traffic safety have explored issues connected with drivers’ locus control. For instance, Rudin-Brown and Noy (2002) reported that locus control was one of the most important factors influencing on the drivers’ adaptation behavior. The studies conducted by different researchers showed contradictory results, which proved that this aspect could not be considered definitely (Arthur & Doverspike, 1992; Guastello & Guastello, 1986; Iversen & Rundmo, 2002; Özkan & Lajunen, 2005).
Özkan and Lajunen (2005) were the ones who paid attention to the theoretical and the methodological defects in studies of this issue; they suggested using multidimensional locus of control scale. Use of new scales showed the following results – that internals (“Self” scale) were more tended to get involved in accidents and commit risky driving rather than externals did (“Vehicle and Environment”, “Other Drivers”, and “Fate” scales).
Impact on driver’s behavior of emotional condition and necessity of self-regulation is described by James and Nahl (2000). The researchers show that emotional disorders and insufficient qualification of the driver become the reasons for aggressive driving.
Like Grey, Triggs, and Haworth (1989) note – personal factors identified as associated with motor vehicle accidents include generally high levels of aggression and hostility, competitiveness, less concern for others, poor driving attitudes, driving to get emotional release, impulsiveness and taking the risk.
The road traffic accidents directly depend on the driver’s stress condition as well (Clapp et al., 2011).
Summarizing factors, which increase probability of aggressive driving, Tasca (2000) identifies the following factors as the most important: driver’s young age; gender belonging – men; being in a traffic situation conferring anonymity and/or where escape is very likely; being generally predisposed to seeking emotions or aggressiveness in other social situations; being in an angry mood (likely due to events that are not related to traffic situation); belief that someone has superior driving skills; traffic jam, but only if drivers do not expect it.
Thus, the studies that are performed in the field of psychology cover the different sides of drivers’ behavior. In this article, attention is accentuated on the personality aspects of drivers with aggressive driving, which is considered from the point of view of drivers-respondents’ ideas on aggressive driving. This article considers evaluation of personality of drivers with aggressive driving.
Method [TOP]
In the course of a multi-stage study, different aspects of the phenomenon of “aggressive driving” were studied since 2004 (e.g., Jenenkova, 2009, 2010, 2012a, 2012b, 2012c). The respondents from all regions of Latvia were surveyed. The following methods were applied during the study: association method; incomplete sentence method; structured, partially structured and non-structured interview; personal semantic differential method; Aggressive Driving Questionnaire (ADQ, e.g., Jenenkova, 2009, 2010, 2012a, 2012b, 2012c).
The Aggressive Driving Questionnaire is meant for research of representations about aggressive driving and includes the following semantic blocks: phenomenon observability; tendencies of the phenomenon under observation; thoughts of the respondents, connected with aggressive driving; characteristics given by the respondents to the present drivers (sex-age, social, personality related); self-concept of knowledge and understanding of normative terminology; manifestations, causes provoking the factors of the present phenomenon; feelings and reactions in relation to the present phenomenon; information awareness of the respondents; evaluation of the level of aggressive driving in Latvia and neighboring countries; measures that are directed to decrease the phenomenon in the society (e.g., Jenenkova, 2009, 2010, 2012a, 2012b, 2012c).
The methodology of personal semantic differential presupposes a possibility of interpreting the obtained data from the point of view of reflection of subjective, emotionally semantic ideas of a person about other people. The factors of evaluation, power and activity are used (Osgood, Suci, & Tannenbaum, 1957). The factor of evaluation shows the level of respect, attractiveness, sympathy, which belong to one person when perceiving other person and the factor of power speaks of the personality’s volitional features.
Participation in the research was voluntary. The respondents were guaranteed confidentiality.
In all, 2160 respondents took part in the study. In this article the study’s results are described, during which a comparative analysis of ideas of the respondents – drivers and road traffic inspectors – were performed in relation to the personality of a driver with aggressive driving style (personality aspect). The number of participants of this study was 300 people, 150 of them were drivers, and 150 – road traffic inspectors. Drivers were men at the age to 30 years, because, according to the statistical data of road traffic accidents in Latvia, male drivers younger than 30 years were the most dangerous for the road traffic participants. Besides, it was discovered during the previous stages of the study that the respondents had described this group as the group of potentially dangerous drivers or the risk group (Jenenkova, 2009, 2010, 2012a, 2012b, 2012c). The respondents indicated the fact that the road inspectors’ opinion about the phenomena of aggressive driving style was opposite to the point of view of young drivers.
Besides, the road traffic inspectors can be the experts in this case. They participate in the traffic and they control and organize the process of traffic. From the point of safety of driving, it was important to learn and compare results of these two groups.
A comparative analysis of ideas of the respondents – drivers and road traffic inspectors – was performed in relation to the personality of a driver with aggressive driving style (personality aspect).
In general, peculiarities of ideas on aggressive driving were analyzed through the main model components – aggressive driving reasons and manifestations, personality factors, as well as emotional, behavior components and information awareness.
In this article, such an aspect of the ideas on aggressive driving like personality factors will be considered.
Results [TOP]
Evaluation of Aggressive Driver’s Personality [TOP]
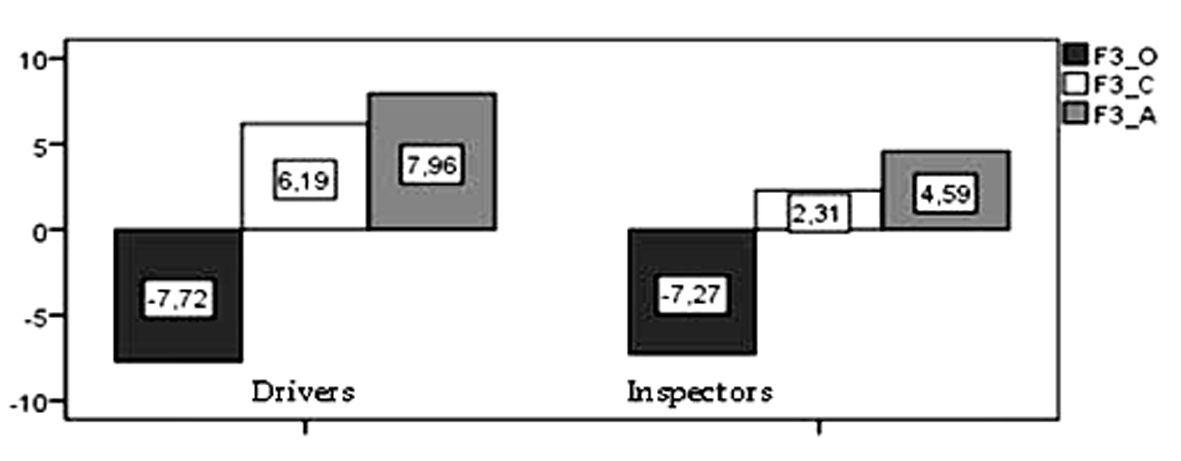
Evaluation of aggressive driver’s personality was performed in the space of three factors: evaluation (F3_O), power (F3_C), activity (F3_A). Distribution of all factors in selection of drivers and inspectors of the road traffic (inspectors) did not considerably differ from the Normal (One-Sample Kolmogorov-Smirnov Test, p > .05).
Figure 1
Average value of the factors characterizing aggressive driver, by the drivers’ and inspectors’ points of view.
Note. Factors: F3_O = evaluation; F3_C = power; F3_A = activity.
All respondents demonstrated negative attitude towards the aggressive driver (Mean F3_O=-7.5) (see Figure 1). More than 75% of respondents evaluated the aggressive driver negatively.
Considerable differences in the evaluation of the aggressive driver (factor F3_O) among drivers and inspectors of the road traffic were not observed (t(298) = .611, р =.541). Power and activity (Mean F3_C = 4.23, Mean F3_A = 6.27) of the aggressive driver were evaluated above the zero level both by drivers (Mean F3_Cdr = 6.19, Mean F3_Adr = 7.96) and inspectors of road traffic (Mean F3_Cinsp = 2.31, Mean F3_Ainsp = 4.59), but the drivers evaluated it higher; and these differences were statistically significant (F3_A: t = 5.637, df = 3, 298, р < .001; F3_C: t = 6.429, df = 3, 298, р < .001).
Interconnection of Personal Factors of Aggressive Drivers [TOP]
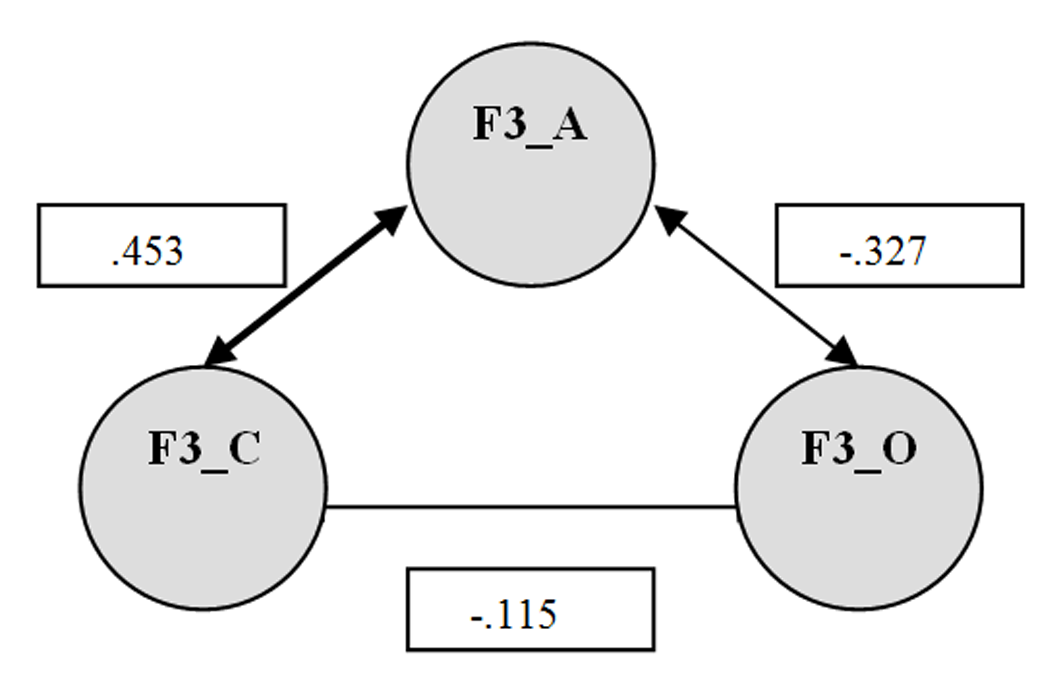
Connection between personal factors was evaluated through calculation of Pearson’s correlation coefficient. There was statistically significant correlation between the factor of activity (F3_A) and the factor of evaluation (F3_O) (r = -.327, р < .001) (see Figure 2 below).
Figure 2
Interconnection between factors characterizing aggressive driver’s personality by the evaluation of both drivers and inspectors of the road traffic.
Note. Factors: F3_O = evaluation; F3_C = power; F3_A = activity.
Connection between the factor of activity (F3_A) and the factor of evaluation (F3_O) was stronger for the inspectors of the road traffic (r = -.394, р < .001), than it was for the drivers (r = -.267, р = .001). Connection between the power (F3_C) and the activity (F3_A) was also statistically significant (r = .453, р < .001). This connection was direct and stronger for the drivers (r = .462, р < .001), than for the road traffic inspectors (r = .307, р < .001). Connection between the power (F3_C) and the evaluation (F3_O) of the aggressive driver for both the drivers and the road traffic inspectors was statistically significant, but weak (r = -.115, р < .05) due to weak, but significant correlation between the power (F3_C) and the evaluation (F3_O) of the aggressive driver from the results of the road traffic inspectors (r = -.203, р <.05).
Thus for both drivers and traffic road inspectors, significant correlations between the factor of activity (F3_A) and the factor of evaluation (F3_O), as well as between the factor of activity (F3_A) and the factor of power (F3_C) were observed. The factor of activity (F3_A) had considerable connections of the average power with the other factors. In the selection of drivers, there was no significant connection between the power (F3_C) and the evaluation (F3_O), whereas it was significant for the road traffic inspectors. Direction of all connections of factors in both groups matched. The drivers had closer connection between the factor of activity (F3_A) and the factor of power (F3_C), whereas the road traffic inspectors had much closer connection between the factor of activity (F3_A) and the factor of evaluation (F3_O).
Cluster Analysis of Personality Factors [TOP]
As a result of two-stage cluster analysis in the plane of power-activity four types of aggressive drivers’ vision were singled out (see Figure 3 below).
Figure 3
Distribution of drivers and inspectors of the road traffic by the clusters CL_CA (power-activity).
The following distribution of all respondents by four clusters was observed: CL1_CA-19%, CL2_CA-31%, CL3_CA-35%, CL4_CA-15%. About 20% of the drivers and 18% of the inspectors of the road traffic were included in the CL1_CA. The CL2_CA consisted of 17% of the drivers and 46% of the inspectors of the road traffic; the CL3_CA – 40% of the drivers and 29% of the inspectors of the road traffic; the CL4_CA – 23% of the drivers and 7% of the inspectors of the road traffic. The existing differences were statistically significant (χ2 = 37.015, df = 3, p < .001).
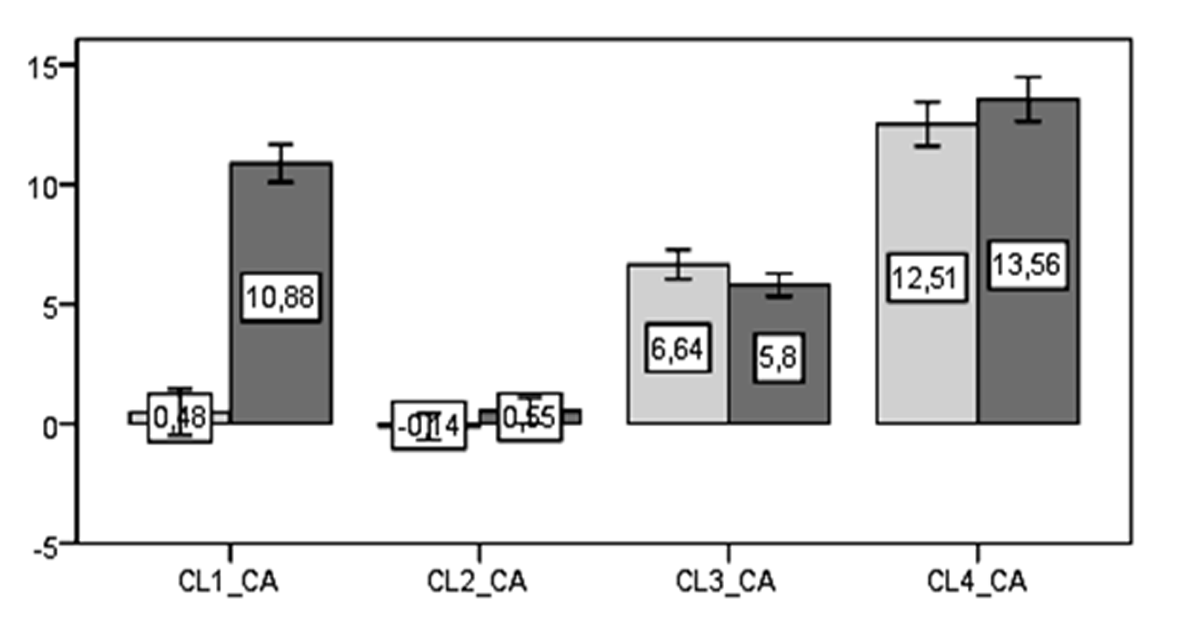
For the first type aggressive drivers, a high level of activity (F3_A) was typical with low level of power (F3_C). In the other clusters, no significant differences between the power and the activity were observed, but the clusters differed by the values. If for the second cluster the power and the activity were close to zero, then for the fourth cluster – their values were more than 12 (see Figure 4).
Figure 4
Average values of the factors of power (in light grey) and activity (in dark grey) for the different types of aggressive drivers by the point of view of the drivers and the traffic road inspectors.
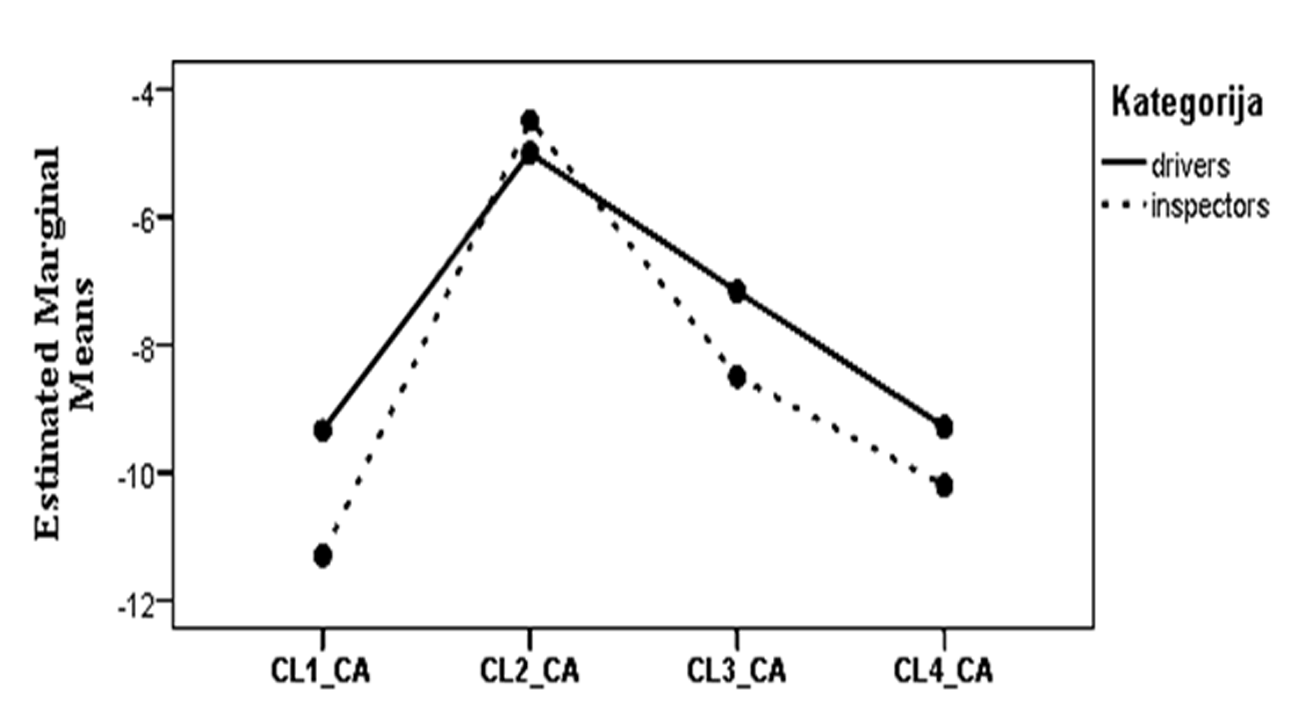
No significant differences in relation to aggressive drivers were found among the drivers-respondents and the inspectors of the road traffic (Tests of Between-Subjects Effects, F = .508, df = 3, р = .677).
The most negative evaluation was given both by drivers and inspectors of the road traffic regarding aggressive drivers of the first and the fourth type, which were distinguished by the high level of activity. The less negative evaluation was given to the drivers of the second category, with comparatively low level of power and activity. These differences were statistically significant (F = 10.382, df = 3, 298, p < .001) (see Figure 5).
Vision of Aggressive Driver’s Personality Together With Reasons and Manifestations [TOP]
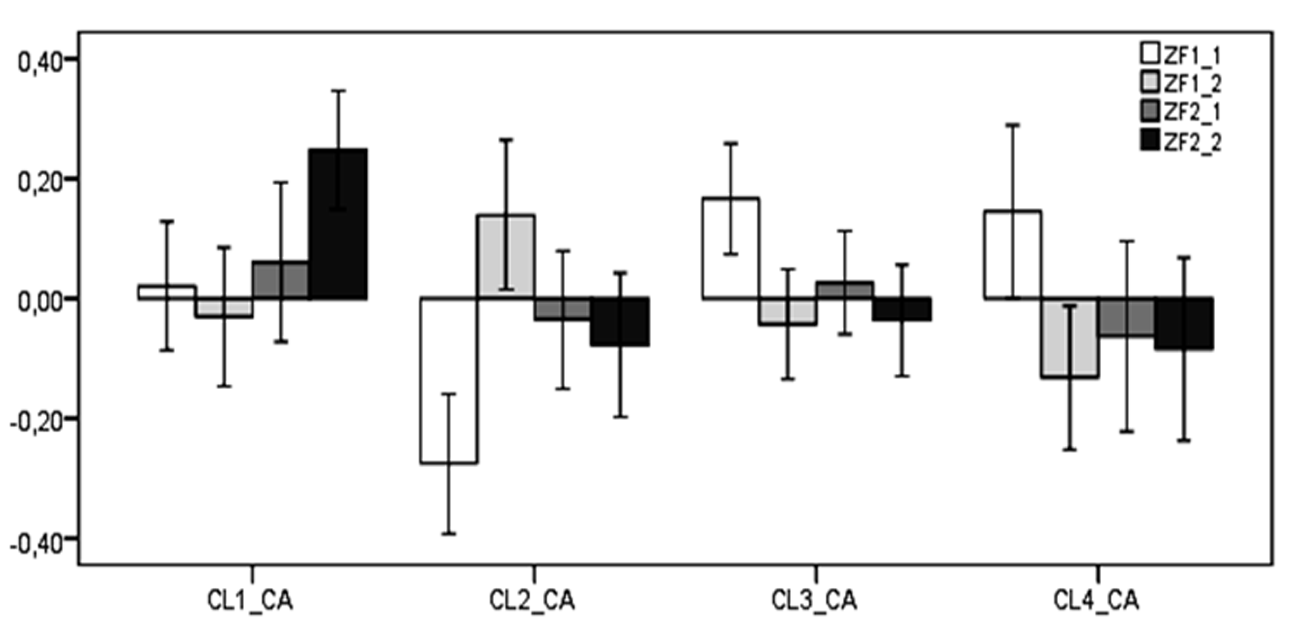
For better understanding of the discovered clusters, it is required to consider such an aspect like the connection between the vision of aggressive drivers and the evaluation of the factors characterizing reasons and manifestations of aggressive driving by the respondents, which is presented in Figure 6.
Figure 6
Average values of the factors characterizing reasons and manifestations of aggressive driving, with different vision of aggressive drivers.
Note. Reasons of aggressive driving: F1_1 = internal, F1_2 = external. Manifestations of aggressive driving: F2_1 = provocations, F2_2 = threat to life. ZF = standardized rates F.
It is required to additionally explain such factors of aggressive driving model like reasons and manifestations, which are used in this analysis. Because these factors are considered in other articles in details (e.g., Jenenkova, 2009, 2010, 2012a, 2012b, 2012c), they will be shortly described only for understanding of the integral picture.
So, analysis of reasons and manifestations of aggressive driving allowed marking out difficult multi-factor structure of the reasons and multi-factor structure of the manifestations. With a purpose of decreasing the dimension of space in each of these two components (reasons and manifestations), as well as for better conceptual force of aggressive driving model, a factor analysis was applied, which allowed uniting manifestations characterizing aggressive driving into two factors: 1) manifestations as provocations (F2_1); 2) manifestations as threat to life (F2_2) (Jenenkova, 2012d).
As a result of the factor analysis of the reasons of aggressive driving, two factors were singled out: 1) internal (F1_1) (personality reasons), which were connected with driver’s personality; 2) external (F1_2) (situation reasons), which were connected with situation (Jenenkova, 2012c).
The respondents who saw aggressive drivers as active and weak were those who evaluated aggressive driving manifestations as highest, threatening life. The respondents who evaluated the level of power and activity of aggressive drivers as low, evaluated the personal reasons of aggressive driving lower than the average; and they evaluated the situation reasons higher, on the contrary. The respondents who evaluated the power and the activity of aggressive drivers on the average and high levels marked out the personal reasons.
Discussion [TOP]
Evaluation of Driver’s Personality [TOP]
The received results, which show the existing differences in the respondents’ ideas about the personality of aggressive drivers and the differences in interconnection of personality factors, probably, are related to the specific nature of professional activity of the road traffic inspectors. On the one hand, the inspectors had more depersonalization in relation to the road traffic participants and expressed more tolerance in relation to evaluation of driver’s personality. On the other hand, due to their professional duties, the road traffic inspectors constantly evaluated the drivers from the point of view of road traffic safety, which determined for them closer connection of factors “activity-evaluation”.
For the drivers, the most important factors were “activity and power”; interconnection of these factors for them was the most powerful. Supposedly, this may influence the further strategy of the drivers-respondents’ behavior causing their wish to comply with the aggressive drivers’ power and activity. Besides, this wish of compliance with the „powerful” and „active” aggressive drivers most probability was observed exactly for those people, which belonged to the respective gender-age group (men younger than 30 years).
Drivers’ Types [TOP]
An integral picture of typology received through cluster analysis and uniting the reasons, manifestations of aggressive driving, as well as vision of personality of aggressive drivers, may be described as follows. The different types of the drivers were found as a result of the cluster analysis procedure.
Summarizing data, it may be stated that the drivers have the following typical features, which are expressed by slogans typical to them:
-
Drivers’ first type (CL1_CA): Slogan – „threat to life”. Drivers of the first type more strongly than other drivers singled out the aggressive driving manifestations in the form of threats to life. On the emotional level, they were characterized as active, but weak. They evaluated personal and situation reasons, as well as manifestations in the form of provocations on average level.
-
Drivers’ second type (CL2_CA): Slogan – „situation’s fault”. Only the drivers of the second type tended to emphasize situation reasons. Besides, they denied personal reasons and did not take into consideration the manifestations of aggressive driving. On the personal level, they were characterized as weak and passive.
-
Drivers’ third type (CL3_CA): Slogan – „driver’s fault”. The drivers on the personal level were characterized as using moderate power and activity. They especially singled out personal reasons, besides, other factors were not so important to them.
-
Drivers’ fourth type (CL4_CA): Slogan – „only driver’s fault”. They thought of drivers as of strong and active. They singled out only personal reasons. Besides, they denied the situation reasons and the manifestations in the form of provocations and threats.
The drivers of the first and the fourth type evaluated aggressive drivers more negatively, and they evaluated aggressive drivers as active.
Conclusions [TOP]
The respondents described the aggressive driver as the bearer of negative, socially undesirable characteristics. The respondents were critical to such drivers and did not tend to consider them as socially attractive. The inspectors were more loyal than the drivers, but there were no significant differences between both groups in relation to their attitude towards the aggressive drivers.
The drivers and the inspectors had statistically significant differences when evaluating the aggressive driver’s personality by such factors like power and activity. The drivers, unlike the road traffic inspectors, tended to perceive the aggressive drivers as more powerful and active.
In the group of the drivers and in the group of the road traffic inspectors, interconnection of the factors „activity-power” was direct, whereas interconnection of „activity-evaluation” and „evaluation-power” had reverse orientation. The existing statistically significant differences in relation to interconnections between drivers and inspectors look as follows:
Connection “activity-evaluation” was much closer for the inspectors, whereas the connection “power–activity” was much closer for the drivers.
The received information from the inspectors may be explained from the point of view of their professional activity. The received results from the drivers may be interpreted from the position of psychological impact of the other drivers, which is shown by them during the road traffic, as well as gender-age peculiarities of this group of respondents.
As a result of the cluster analysis procedure, four different types of drivers were found. The types of drivers were presented in compliance with the evaluation of the personality factors, and the reasons and manifestations of aggressive driving. The peculiarities of the ideas of aggressive driving for each driver type were presented as slogans typical to them. The following slogans towards aggressive driving were used: 1) drivers’ first type: „threat to life”; 2) drivers’ second type: „situation’s fault”; 3) drivers’ third type: „driver’s fault”; 4) drivers’ fourth type: „only driver’s fault”. The drivers of the first and the fourth type evaluated aggressive drivers more negatively, and as active.

 This is an open access article distributed under the terms of the Creative Commons
Attribution License (